


With global bond yields on the high side, there are understandably fears of a credit event hitting the markets.
However, based on the charts, these fears are overblown.
Credit spreads are not flashing danger. This is especially so in the emerging market space, which is more vulnerable to higher bond yields and a stronger USD.
I will now look at credit spreads through the performances of 1) high yield bonds ETF and 2) emerging market corporate bonds ETF relative to treasury bonds ETF.
High yield bonds ETF, iShares iBoxx $ High Yield Corporate Bond ETF, (NYSEARCA:HYG) are actually breaking out from a 9 year base versus treasury bonds ETF (TLT). This hardly reflects danger, does it?
Monthly Chart: HYG/TLT
Tradingview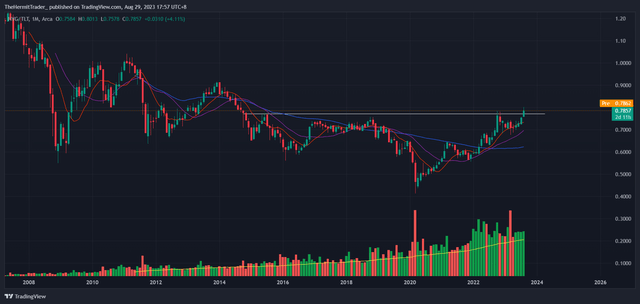
Next, we look at the performance of emerging market corporate bonds ETF (CEMB) relative to treasury bonds ETF.
Very similarly, emerging market corporate bonds are also breaking out from a 9 year base versus treasuries.
Monthly Chart: CEMB/TLT
Tradingview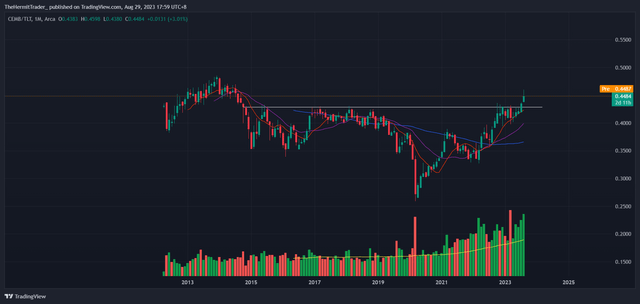
If we are truly on the verge of a cataclysmic credit event, we can be very sure that investors will be flocking to treasuries at the expense of high yield and emerging market bonds.
Furthermore, these ratios are breaking out from huge bases (9 years). It is not often in the world of charts that things break out from such long term bases.
As the saying goes, “the larger the base, the higher in space”. This breakout could be very advantageous for high yield and emerging market bonds going forward.
It also speaks volumes that high yield and emerging market bonds are breaking out at a time when global interest rates are on the march higher.
Rapidly rising interest rates should theoretically spook investors out of these bonds, but money is instead flowing into them.
I do not have a clear reason for why this is happening, but I think the inflows into HYG and CEMB warrant an investment into these bond spaces.
Out of the two, I would prefer HYG, as it has a higher dividend yield of 5.3%, versus 4.3% for CEMB. Dividend yield is a very important reason for investing in a bond ETF.
The ratio of HYG against CEMB also looks more constructive to the upside, as it is building out a big base.
Monthly Chart: HYG/CEMB
Tradingview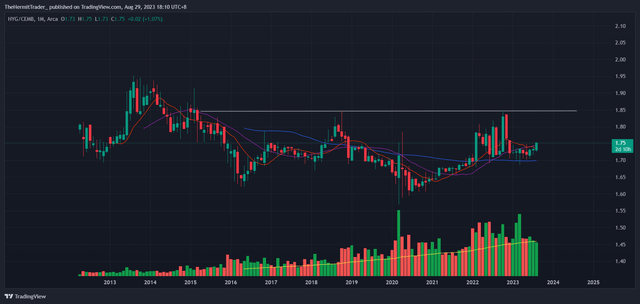
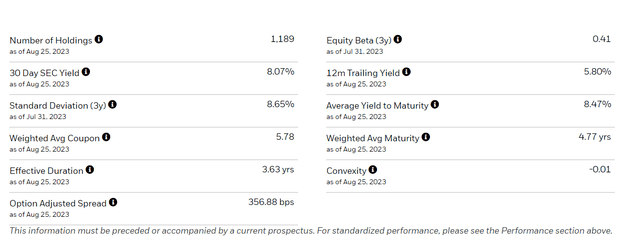
I also like the diversification in HYG, whereby the top 10 issuers make up ~15% of the portfolio. There are 1,189 holdings in the ETF, and the average yield to maturity is 8.47%, so there is certainly room for the dividend yield to rise.
iShares iShares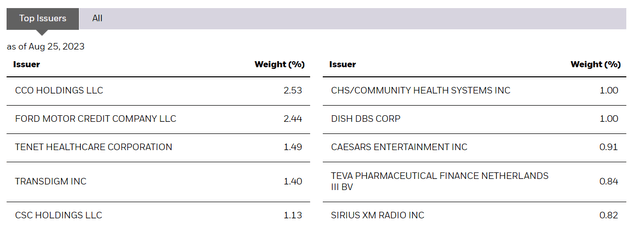
The majority of the bonds held in the ETF are BB-rated, just a tier below the BBB investment grade.
iShares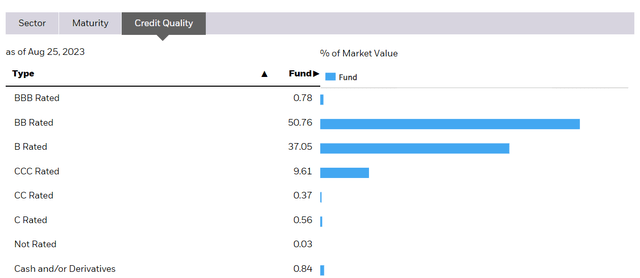
To get a sense of the amount of fear in the credit markets, HYG is trading at levels seen near the depths of 2020 and 2008-2009. Price has been steady for close to half a year, and is consolidating very well.
Monthly Chart: HYG
Tradingview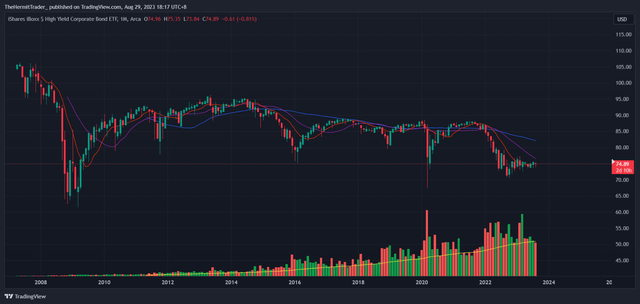
On average, the ETF has returned 4.45% per year since inception, close to the benchmark index.
iShares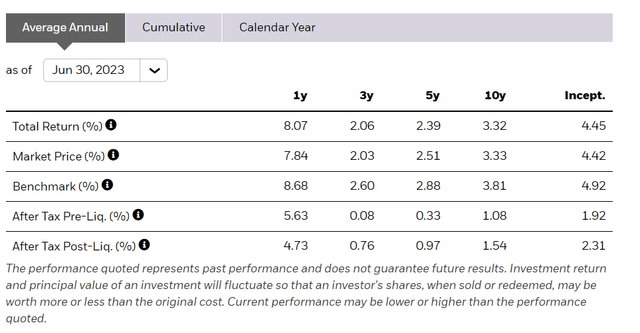
To conclude, what I am getting at is that fears of a major credit event are vastly overblown.
In fact, high yield bonds and emerging market corporate bonds are breaking out against safe-haven treasury bonds. The breakouts are from long-term 9-year bases, and can potentially be very powerful.
Furthermore, these breakouts are occurring during a rising interest rate environment.
Money is flowing into HYG and CEMB, and although the reasons are not evident yet, the aim of technical analysis is to follow the money flows. I am bullish on both HYG and CEMB.
Read the full article here