


While screening for high yielding investments, I came across the SPDR Blackstone High Income ETF (BATS:HYBL). The HYBL ETF is managed by Blackstone, the well-known private equity and alternative asset manager. It seeks to generate high income from a portfolio of leveraged loans and high yield bonds.
Although the HYBL ETF pays an attractive 7.1% trailing distribution yield, I am concerned about the fund underperforming its underlying asset classes. A confusing ‘benchmark’ also raises some warning signs. For now, I suggest investors seeking high yielding investments to look elsewhere.
Fund Overview
The SPDR Blackstone High Income ETF (HYBL) is an actively managed ETF that seeks high current income and superior risk-adjusted return from a portfolio of high yield bonds, leveraged loans and debt tranches of collateralized loan obligations (“CLOs”). The manager uses a top-down asset allocation approach to determine the relative weights of the asset classes, while individual securities are selected using a bottom-up process.
The HYBL ETF is a relatively new fund, with an inception date of February 16, 2022. The HYBL ETF has $126 million in net assets and charges a 0.70% expense ratio.
Portfolio Holdings
Figure 1 summarizes the portfolio characteristics of the HYBL ETF. The ETF holds 507 securities with a weighted average spread of 3.6% and 5.1 years average maturity. The weighted average all-in rate of the portfolio is 7.2%.
Figure 1 – HYBL portfolio overview (ssga.com)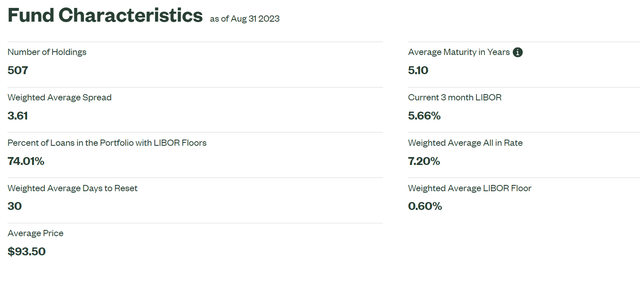
While having weighted average spread and maturity information is useful, one important piece of information appears to be missing from the fund’s website, namely, the weighted average duration of HYBL’s portfolio. Leveraged loans are usually struck on floating rate benchmarks such as LIBOR or SOFR and have duration close to zero, but high yield corporate bonds, being fixed coupon instruments, have duration risk. Without duration information, it is difficult to analyze HYBL’s portfolio.
Figure 2 shows the asset allocation breakdown of the HYBL ETF. It is currently 47% allocated to leveraged loans, 45% allocated to high yield bonds, and 7% allocated to CLOs.
Figure 2 – HYBL asset allocation (ssga.com)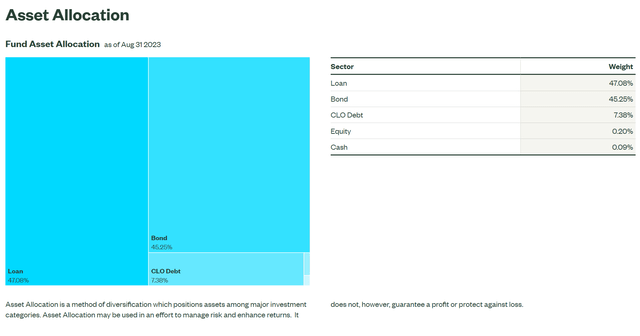
Figure 3 shows the credit quality allocation of the fund. The vast majority of the HYBL ETF’s assets are classified as BB-rated (39.8%) and single B-rated (52.8%).
Figure 3 – HYBL credit quality allocation (ssga.com)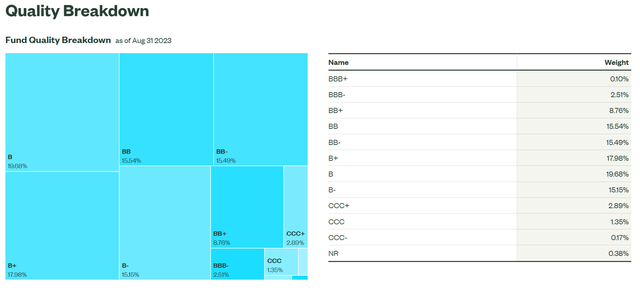
Returns
Figure 4 shows the limited historical returns of the HYBL ETF, as well as its Primary and Secondary benchmarks. On a 1Yr basis to July 31, 2023, the HYBL ETF has returned a solid 5.5% on NAV. However, since inception, the annualized return is a more modest 0.8%.
Figure 4 – HYBL historical returns (ssga.com)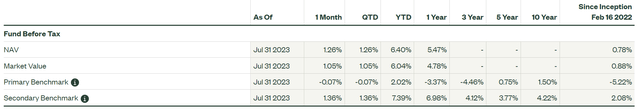
According to the fund’s website, the HYBL ETF has outperformed its ‘Primary Benchmark’, with the Primary Benchmark returning -3.4% on a 1Yr basis and -5.2% since inception of HYBL.
However, readers should note that the Primary Benchmark chosen by the HYBL ETF may not be an accurate reference. The Primary benchmark chosen is the Bloomberg U.S. Aggregate Bond Index (“AGG Index”), which measures the performance of the U.S. dollar denominated investment grade bond market (bonds rated BBB or above), including treasuries, corporate bonds, mortgage-backed securities (“MBS”) and other asset backed securities.
First, the AGG Index measures investment grade bonds, but the HYBL ETF primarily invests in high yield bonds and leveraged loans. So comparing HYBL to the AGG Index is like comparing apples to oranges. Second, the AGG Index, modeled using the iShares Core U.S. Aggregate Bond ETF (AGG), has a weighted average duration of 8.6 years. In an era of rising interest rates, the AGG Index is bound to underperform a portfolio which includes leveraged loans with close to zero duration (and hence my criticism that the HYBL ETF does not show its portfolio duration earlier in the article).
A more appropriate benchmark may be the ‘Secondary Benchmark’, which is a 50%/50% blend of the ICE BofA US High Yield Constrained Index and the Morningstar LSTA Leveraged Loan Index. Compared against the Secondary Benchmark, we can see the HYBL has underperformed on a 1Yr basis (5.5% vs. 7.0% returns) and since inception (0.8% vs. 2.1%).
This sleigh of hand in marketing the HYBL ETF against its ‘Primary Benchmark’ leaves a sour taste in my mouth.
In fact, if we compare HYBL’s returns against standalone passive funds such as the Invesco Senior Loan ETF (BKLN) and the iShares iBoxx $ High Yield Corporate Bond ETF (HYG), HYBL’s returns are less impressive. On a 1Yr basis to August 31, 2023, the HYBL ETF has delivered the same total return as the HYG ETF, even though approximately half of the portfolio is comprised of floating rate leveraged loans that should have outperformed like the BKLN ETF (Figure 5).
Figure 5 – HYBL underperforms BKLN while matching HYG (Seeking Alpha)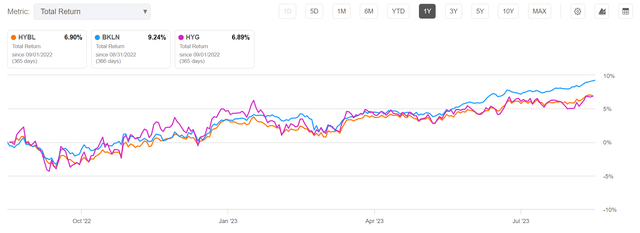
The HYBL ETF is also more expensive, at a 0.70% expense ratio, compared to 0.65% for BKLN and 0.49% for HYG.
Distribution
The HYBL ETF pays an attractive monthly distribution, with trailing 12 month distribution of $1.99 / share or 7.1% (Figure 6).
Figure 6 – HYBL distribution (Seeking Alpha)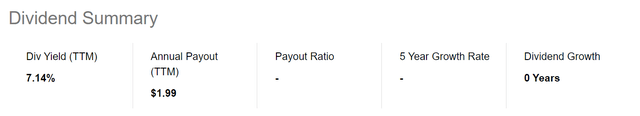
Given the current high interest rate environment, both leveraged loans and high yield bonds are delivering strong distribution yields, so I have no immediate concerns with HYBL’s distribution rate.
For example, from Figure 1 above, we can see that with 3-month LIBOR yielding 5.66% and an average spread of 3.61%, HYBL’s leveraged loan investments should be yielding over 9%. Similarly, high yield bonds, measured by the ICE BofA U.S. High Yield Index, is yielding over 8% (Figure 7).
Figure 7 – High yield bonds are yielding over 8% (St. Louis Ved)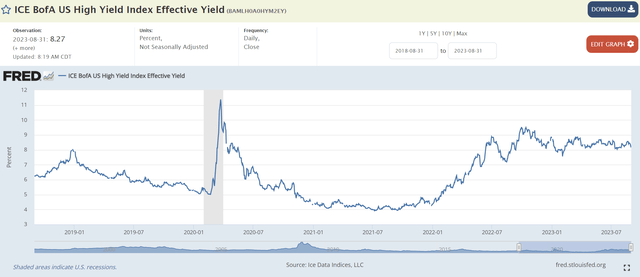
But Beware Rising Default Rates
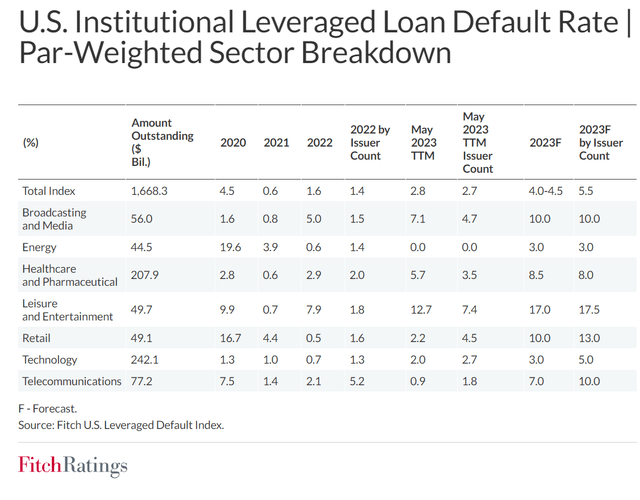
However, against these high distribution yields, investors need to be mindful of rising defaults within the high yield investment space. Fitch Ratings is forecasting high yield bond default rates of 4.5-5.0% and leveraged loan default rates of 4.0-4.5% (Figure 8 and 9).
Figure 8 – High yield bond defaults are expected to rise (Fitch Ratings) Figure 9 – Ditto for leveraged loans (Fitch Ratings)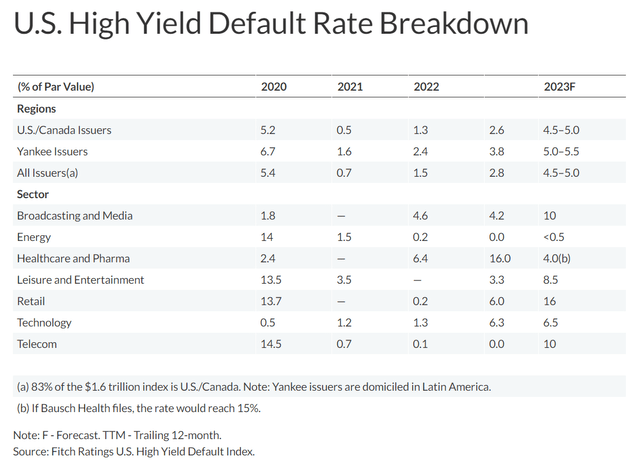
Conclusion
The SPDR Blackstone High Income ETF is a recently launched active ETF that aims to deliver high current income from a portfolio of high yield bonds, leveraged loans, and CLO debt tranches.
Although the fund pays an attractive 7.1% trailing distribution yield, I am concerned that it has lagged a simple 50/50 allocation of the underlying asset classes, as modeled by the BKLN and HYG ETFs. I am also concerned that HYBL ETF’s ‘Primary Benchmark’ may make it appear to be an outperforming fund.
Until there is proof in the pudding (i.e. the HYBL ETF actually outperforming the underlying asset classes), I suggest investors seeking yield to look elsewhere. I rate HYBL a hold.
Read the full article here