


Did I miss anything while I was hiking?
That’s a joke, of course. The peace, tranquility, and quiet of the cool mountain air I’ve enjoyed over the last few weeks contrasts sharply with the chaos happening in the rest of the world.
As investors, there are aspects of this chaos that need to be addressed.
Anytime I discuss the economic effects of government policy (or proposed policy changes), some readers comment that I should steer clear of “politics.”
But to write about macroeconomics every week as I do and not mention the US election and its potential economic effects would, in my estimation, be political. To pretend that it will have no effect would be doing a disservice to anyone reading.
So I will discuss the probable economic effects of a potential Republican sweep (which currently appears likely) in the same way that CNBC and other financial media outlets do: By focusing on the economics and investment implications.
I’ll focus primarily on Trump’s three marquee policies: (1) protectionism, (2) immigration restrictionism, and (3) loose fiscal policy.
Here’s the table of contents:
- So much is happening right now.
- Ratcheting up the trade war.
- Immigration restrictions and deportation’s effect on the labor market.
- The potential consequences of loose fiscal policy: Spiraling inflation or Japanification?
- My contrarian buy list right now.
Let’s begin.
Everything, Everywhere, All At Once
So much is happening right now, both on the political and economic side, that matters to investors.
All the noise happening in politics may have obscured the rising trend in unemployment claims reported this past week, which simultaneously caused a market selloff as well as increasing Fed rate cut probabilities.
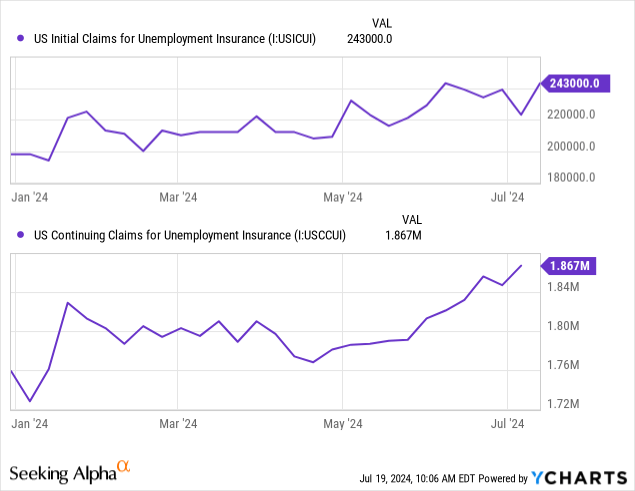
It’s as if the market is saying: “Wait a minute. We’ve seen this before. The Fed Funds Rate is at a cyclical peak. The yield curve has been inverted for a long while. Consumer spending is slowing. The labor market is weakening. Cyclical sectors are collapsing. And the leading stocks may have priced in too much euphoria. Could we be on our way to a recession?”
Good question.
The chart below is admittedly more correlation than causation, but it does demonstrate a correlation between peaks in the ratio of cap-weighted to equal-weighted S&P 500 indices and the occurrence of recessions.
SocGen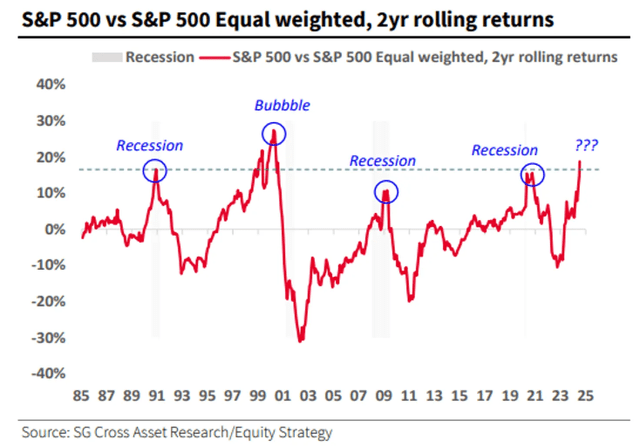
Will the historical pattern hold? Or is this time different?
I think the burden of proof is always on those who say this time is different.
Meanwhile, in the electoral realm, the speed with which momentous things (e.g. an assassination attempt, calls for a presumed presidential nominee to drop out, etc.) are happening is extraordinary.
As things stand today, the prediction markets expect Donald Trump to win in November by overwhelming odds.
PredictIt Presidential Election Odds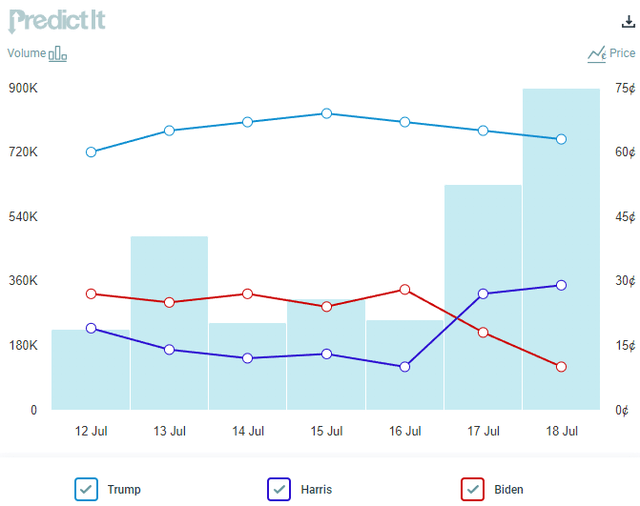
While many US elections have only relatively minor effects on the investment outlook, there is a case to be made that a second Trump term could bring with it significant economic changes of which investors ought to be aware.
Return Of The Trade War
The two largest manufacturers in the world appear to be on the brink of an expanded trade war.
China is the largest manufacturer in the world as measured by real (inflation-adjusted) output, and the US is the second-largest manufacturer in the world.
(This contrasts with the oft-repeated line that “we don’t make things in America anymore.”)
Trump appears to be quite serious about ratcheting up the trade war again if he becomes president, and it should be noted that the power to set tariff policy is at the sole discretion of the president. Unlike other tax policy, Trump would not need to go through Congress or pass any laws to raise tariffs. He could raise tariffs through executive action.
Before the Civil War and long before the introduction of the personal income tax in the early 1900s, tariffs played a key role in both collecting federal government tax revenues and protecting American production. But the economy was very different back then, as the vast majority of the workforce and of GDP were tied to agriculture or some sort of industrial production.
In the modern economy, the removal of tariffs led to dramatic reductions in the prices of a wide variety of consumer goods while facilitating an evolution toward a mostly services-based economy.
And yet, protectionism seems to be renascent.
Perhaps this is because of the common misconception that foreign importers are the ones who pay for the tariffs. In reality, US consumers and businesses end up paying for the vast majority of the import taxes.
So far, Trump’s proposed tariffs include a 10% across-the-board tax on all imports, regardless of origin country, as well as 60-100% tariffs on goods from China.
For context, those proposed tariff rates on Chinese imports range from 3x to 5x higher than the tariffs imposed in 2018-2019. And a 10% across-the-board tariff rate would be 3.3x higher than the current average rate for non-China import origins.
But how well did those 2018-2019 tariffs on Chinese goods work at stimulating the US manufacturing sector?
Answer: Not at all. They actually appear to have had a negative effect on US manufacturing.
Consider this. The initial round of tariffs on Chinese imports were imposed in September 2018. From September 2018 to June 2024, total US employment has increased by 9.28 million jobs, or 6.2%.
Total US Nonfarm Employment:
St. Louis Fed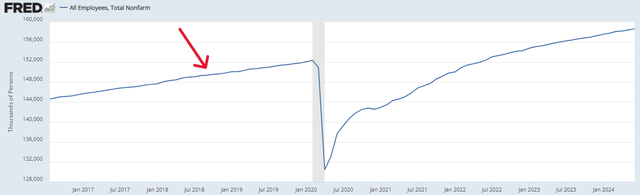
As you can see, total employment kept on growing right up until the COVID-19 crash and has grown steadily in the post-COVID recovery.
Meanwhile, during that same time period, manufacturing employment in the US has increased by 206,000 jobs, or 1.6%. In other words, manufacturing jobs account for a mere 2.2% of total jobs gained in the US between September 2018 and June 2024.
US Manufacturing Employment:
St. Louis Fed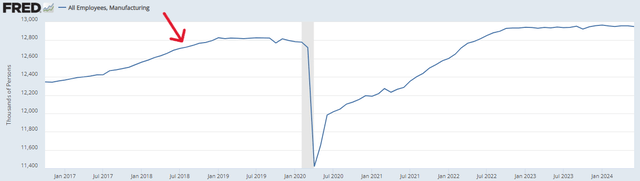
As you can see, manufacturing employment flatlined for about a year in 2019 just a few months after the tariff regime began. Tariff rates continued rising until their peak in around mid-2019. Rather than seeing an increase in the growth of US manufacturing employment after the tariffs took effect, the growth of employment in this sector of the economy halted.
And after recovering from COVID-19, manufacturing employment has basically flatlined since October 2022.
Moreover, interestingly, US manufacturing output peaked in September 2018, the month that Trump’s tariffs began taking effect. Since then, manufacturing output has been flat to down.
US Manufacturing Output:
St. Louis Fed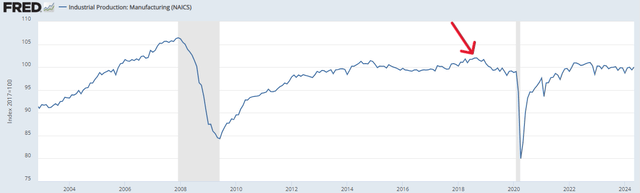
As of the latest reading in May 2024, manufacturing output is down about 2% from its peak.
Here’s another way of measuring US manufacturing output that shows the same peak occurring in Q3 2018.
Real Manufacturing Output For All Workers:
St. Louis Fed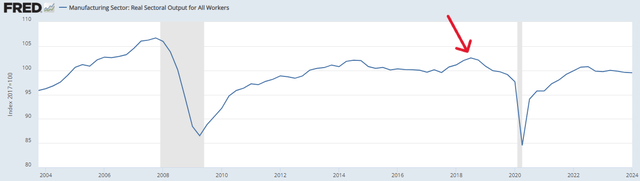
There are a few reasons why US manufacturing declined following the implementation of the tariffs.
First, US manufacturers rely significantly on raw materials and/or intermediate goods from China to produce their own final goods. About 25% of all imports into the US are industrial supplies that support US manufacturing jobs and output.
The spike in US manufacturing output in the first three quarters of 2018 probably came from a surge of input supplies from China that immediately went into producing final products in the US. You can see the surge in imports from China in 2017 and into 2018 to front-run the tariffs, and then the falloff of imports from China after the tariffs’ implementation.
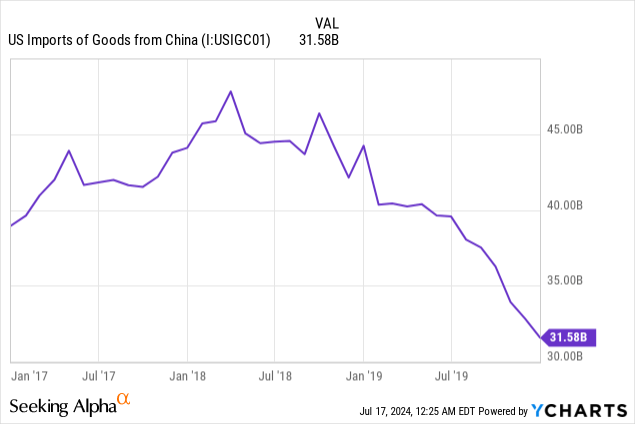
As I’ve written in a previous article, the loss of imports from China didn’t result in a corresponding increase in US manufacturing output but rather simply a reshuffling of supply lines to other foreign countries.
The second reason why US manufacturing declined or stagnated after the implementation of the tariffs is that China placed retaliatory tariffs on the US.
Here’s a chart I shared in “8 Stocks I’m Buying As A Resurgent Trade War Looms” showing the tit-for-tat tariff walls going up on both sides of the US-China trade war:
Peterson Institute for International Economics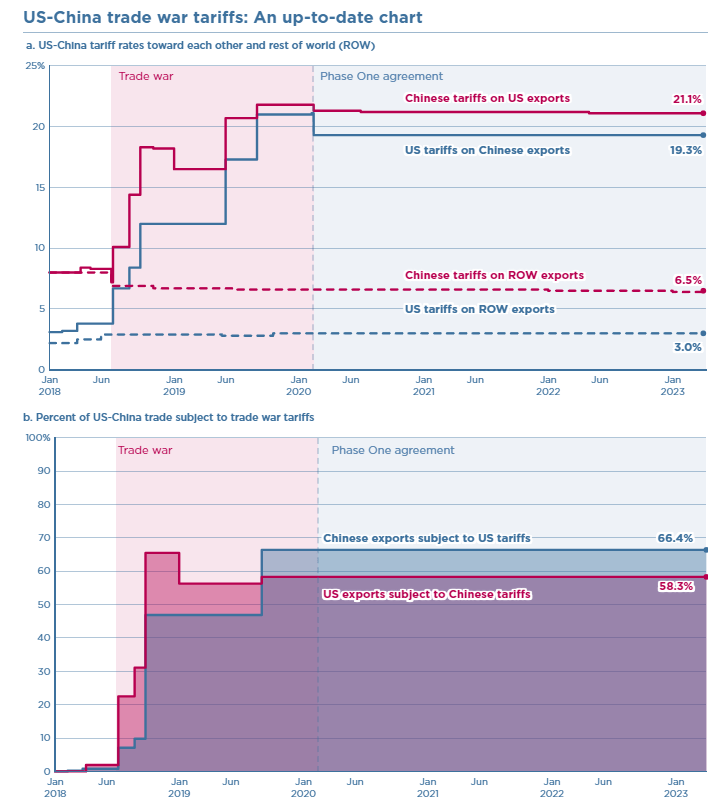
(This chart throws water on the idea that Trump’s tariffs are mere temporary measures that act as negotiating chips in working out new, better trade deals. The “Phase One” agreement reached with China in early 2020 only lowered tariffs on Chinese imports from 21% to 19% and Chinese tariffs on US goods from 22% to 21%.)
As you might expect, US manufacturers don’t just produce goods for US consumption but also for exportation to other countries. China is the third-largest destination country for US-produced goods.
Naturally, with those retaliatory tariffs in place, Chinese imports of goods from the US sharply declined — at least until COVID-19 hit.
As I’ve argued in the past, the idea that Trump’s tariff strategy is merely to extract better trade terms with other countries has little merit. The Republican Party has come to embrace tariffs both as a permanent method of raising tax revenue and as a means to protect US manufacturing from foreign competition.
Trump’s proposals for his second term reflect this.
As I explained in “7 Stocks & 1 ETF I’m Buying The Second Week Of July,” the implementation of Trump’s proposed tariffs would highly likely lead to meaningful inflation in the US.
Why?
Consider that the cost differential between US and foreign suppliers is usually well in excess of 10%. Therefore, 10% across-the-board tariffs would in most cases flow directly into higher prices for US consumers and businesses.
Rather than build expensive new factories in the US and hire relatively high-cost American laborers, it will usually be more cost effective for US businesses to simply pay the import tax on foreign-made goods and pass that cost onto American consumers and/or eat a portion of it in the form of lower margins.
Surely in some cases in which there are already American producers of a certain good, it will make more sense to switch from a foreign supplier to a US one. But in these cases, too, additional costs to the business will either be passed on to consumers or will compress businesses’ margins, or both.
Of course, it must be said that offsetting the likely negative economic effects of higher tariffs would be deregulations, an extension of tax cuts, and a potential lowering of the corporate tax rate to 15%, which are widely expected to be beneficial to US businesses.
Even so, I think the negative effects of tariffs (higher inflation, lower real GDP growth, disruptions to supply chains) would be the most pronounced and influential part of Trump’s economic agenda.
The Economic Consequences of Immigration Restriction and Mass Deportation
Trump has promised to bring back the restrictionist immigration policies from his first term as well as to implement “the largest deportation operation in the history of our country.”
One intention of restricting immigration and deporting those who live in the US illegally is to benefit native-born workers. The idea is that fewer immigrant workers will be present to compete with native-born workers and thus wages will have to rise.
On the surface, this too is an inflationary policy, because businesses tend to raise prices to offset higher wages. (See this recent study from the grocery industry as well as this research from the UK showing price hikes in response to wage increases.)
This is known as the “wage-price spiral.” It is one way that inflation can become entrenched in an economy.
An economy is especially vulnerable to a wage-price spiral taking off when it is experiencing a structural labor shortage.
If not for immigration, the United States would be suffering from an indefinite labor shortage.
Don’t believe me? Just look at some data on employment in the US.
Today, the number of native-born Americans in the workforce is slightly lower than its pre-COVID peak in October 2019.
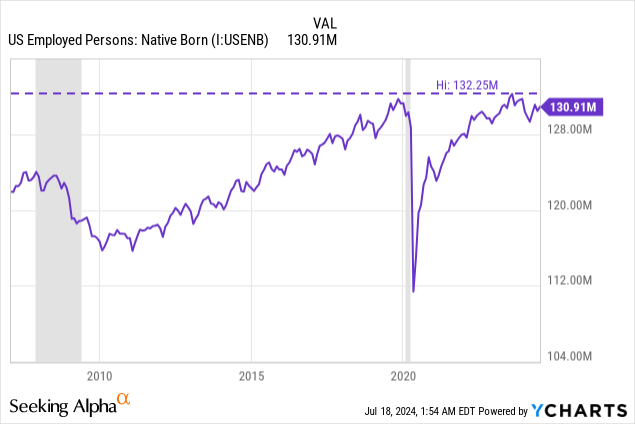
How could this be possible when we know that there are over 5 million more jobs in the US today than before COVID-19 struck?
Two reasons:
- Over 8.3 million Americans are multiple jobholders, which is near its record high
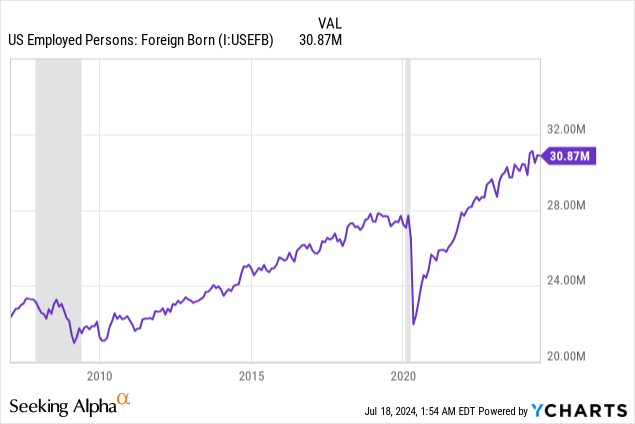
- Foreign-born (immigrant) workers have been entering the labor force in high numbers
The foreign-born segment of the US labor force is nearly 3 million people larger today than before COVID-19.
The main reason why the native-born workforce isn’t growing is aging demographics. There are more native-born workers retiring and leaving the workforce than younger workers entering it.
We can see aging demographics slowly altering the structure of the labor market in this chart:
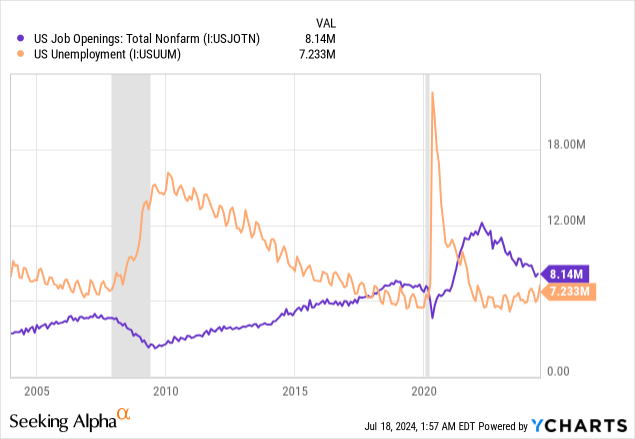
As you can see, for a very long time, job openings remained well below the number of unemployed Americans, implying a labor surplus.
But as the number of retirements outpace the number of entrants into the workforce, job openings have steadily grown over time to the point where openings outnumbered unemployment even before the pandemic began.
This is a sign of the structural labor shortage present in the US economy.
Immigrants have been plugging that gap and bringing down the total number of job openings, but if you cut off the flow of immigration into the US (or significantly curtail it), the labor shortage will reassert itself, likely leading to a wage-price spiral.
Mass deportation would have even more severe effects, because rather than leaving job openings unfilled, it would create more job openings.
Not to mention the negative effects that a loss of overall population would have on aggregate demand and total consumption. After all, fewer people in the country translates to less consumer spending, which in turn translates into less revenue for businesses.
This article from the Miami Herald details more of the likely economic effects of mass deportation.
In my estimation, mass deportation would likely trigger at least a temporary bout of inflation due to a wage-price spiral. It could turn out to be a longer-running inflationary pressure.
Loose Fiscal Policy & Deficit Spending
To be clear, both Trump and Biden have put the pedal to the metal when it comes to fiscal policy and deficit spending.
The common belief (misconception, in my view) is that deficit spending always promotes GDP growth and inflation. But in reality, it depends on the kind of spending that the government is doing.
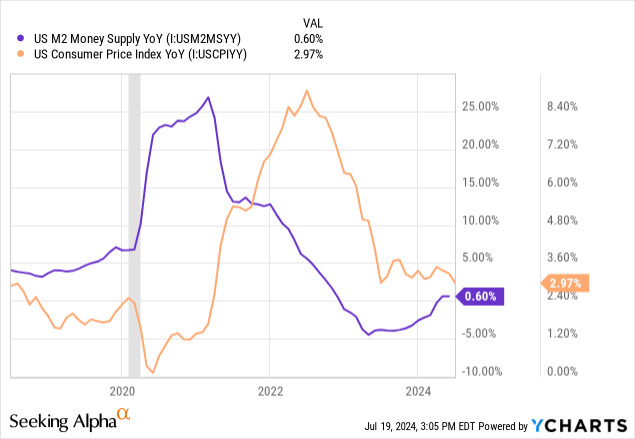
When it comes to inflation, remember that inflation is basically caused by too much money chasing too few goods.
Since government spending tends not to produce new goods, the key metric to watch is not the deficit itself but rather the money supply.
There is no correlation between the level of the deficit and inflation, but there is a strong correlation between the growth of the money supply and inflation.
As we saw during and after COVID-19, the massive surge in money circulating in the economy (via stimulus checks, enhanced unemployment benefits, PPP loans, etc.) translated into a massive spike in inflation about a year later.
Deficit spending during COVID generated inflation because it created money and directly gave it to consumers to spend at the same time that production and supply chains collapsed for pandemic-related reasons.
Even if production had continued apace and supply lines remained intact, though, it is likely that such a huge and sudden surge of money still would have generated inflation.
On the other hand, contrast the large deficit spending of about $1.3 trillion in the first three quarters of fiscal 2024 (~6% of GDP annualized) with the falling rate of inflation.
Why does today’s deficit spending not generate inflation?
It is because today, unlike 2020-2021, the kinds of things the government is spending money on are not meaningfully increasing the money supply.
Today, growth in government spending is mostly coming from interest expense, Social Security, Medicare, Medicaid, defense, and subsidies for green energy and infrastructure investment.
As of the latest CBO projection, virtually all growth in government spending over the next decade is expected to come from mandatory sources (Social Security & healthcare programs) and interest expense.
CBO Budget And Economic Outlook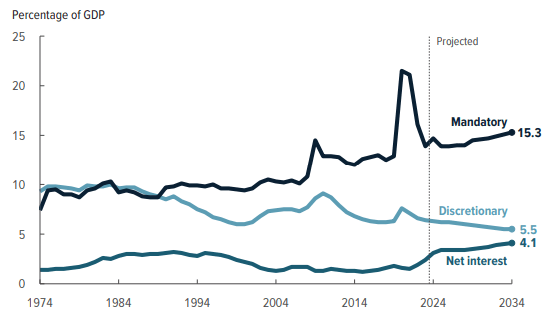
This assumes no changes to the law or additional spending passed by Congress.
Social Security is not inflationary, because (1) SS benefits are usually a fraction of retirees’ previous labor income, and (2) retirees typically spend 20-40% less in retirement than they did when they were employed.
Healthcare programs likely do contribute to inflation in the healthcare space but nowhere else.
Do rising government interest payments spur inflation? Probably not, or at least not very much. The vast majority of Treasury debt owners are various parts of the government, foreigners, US mutual funds, depository institutions, pensions, and insurance companies.
Peter G. Peterson Foundation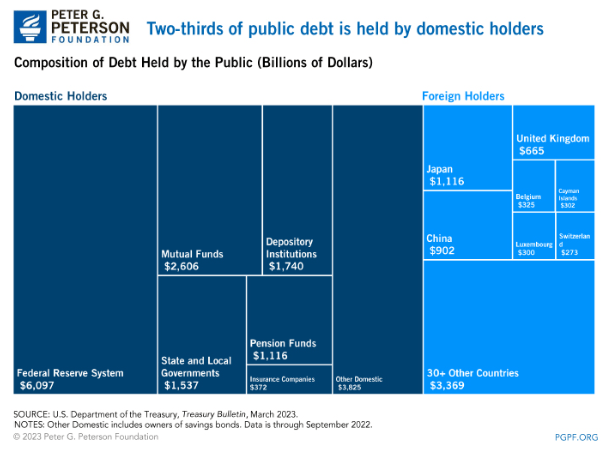
Only about 10% of federal debt is owned by private, non-institutional owners. While some portion of that probably gets spent, most of it remains in the financial system and/or gets reinvested in other assets.
For those interested, the non-partisan Committee For A Responsible Federal Budget performed analysis on the amount of new debt (deficit spending) approved during the first terms of both Trump and Biden.
This chart shows the amount of incremental debt each president approved over a 10-year period:
Committee For A Responsible Federal Budget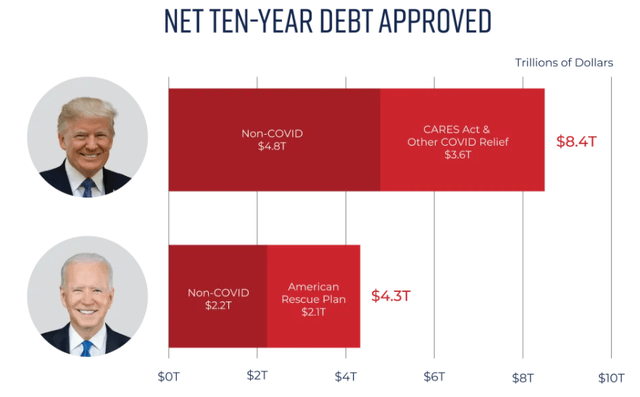
The chart includes not only new spending but also spending cuts as well as the revenue side — tax cuts/hikes.
Outside of “helicopter money” type government spending that directly grows the money supply and increases consumer spending power, more government debt accumulation tends instead to weigh down economic growth.
A 2020 meta-analysis of 10 years’ worth of economic studies found that, for excessively indebted countries with debt-to-GDP ratios above a certain threshold, more debt usually resulted in slower economic growth.
This is the “Japanification” thesis.
For decades now, Japan’s government debt to GDP has risen and risen, while real GDP growth has been consistently meager.
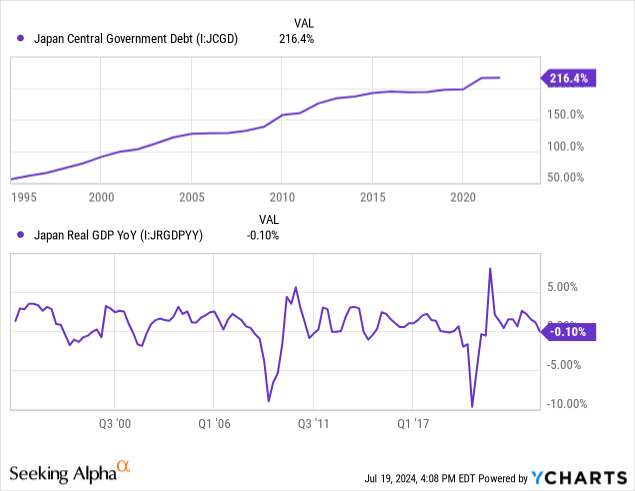
Likewise, up until a burst in the money supply starting in 2020, Japan’s inflation rate has long been anemic as well.
From the beginning of 2019 to today, Japan’s money supply has grown 24%, significantly faster than its previous historical rate. That translated into a peak inflation rate of a little over 4%.
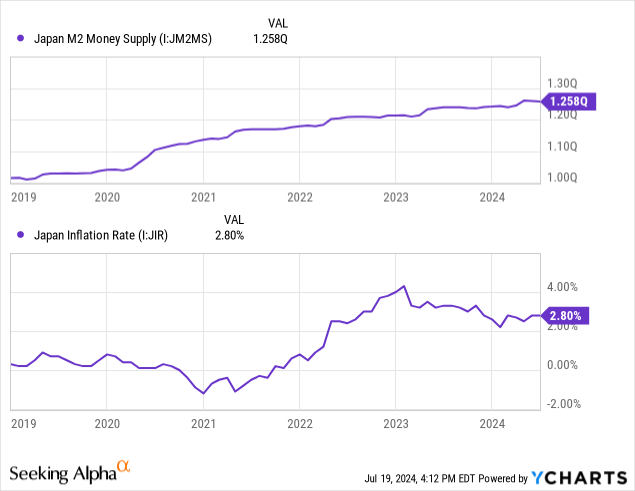
In lieu of another burst in the money supply, the US economy will likely slip back into the low growth, low inflation environment that characterized it before COVID-19 began — the same low growth, low inflation environment that characterized Japan’s economy from around 1990 to 2020.
My Buy List
I’m taking a bit of a contrarian stance with the stocks on my buy list right now.
| Dividend Yield | Projected Forward Dividend Growth (Guesstime) | |
| American Homes 4 Rent 6.25% Preferred Series H (AMH.PR.H) | 6.5% | N/A |
| Brookfield Renewable (BEP, BEPC) | 5.9% | Mid-Single-Digit |
| Clearway Energy Inc. (CWEN, CWEN.A) | 7.1% | Mid-Single-Digit |
| Rexford Industrial (REXR) | 3.4% | High-Single-Digit to Low-Double-Digit |
Trump has stated his intention to repeal the “Inflation Reduction Act,” a legislative package that promotes clean energy but does nothing in particular to actually reduce inflation.
Recent analysis put out by Columbia Threadneedle Investments argues that while a full repeal of the IRA is unlikely, a partial repeal is possible.
The reason why an IRA repeal is unlikely is that much of its subsidies flow into Republican and swing states. Here’s an illustration of green manufacturing subsidies by state:
Columbia Threadneedle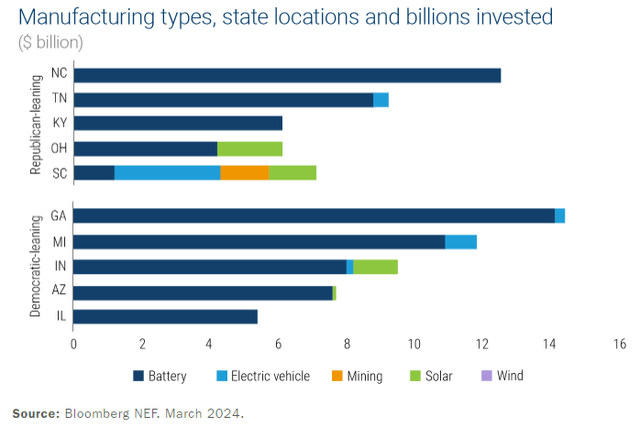
While this image shows Indiana as “democratic-leaning,” the state reliably votes Republican, and Georgia, Michigan, and Arizona are all swing states.
It seems unlikely that Republicans in these states will vote to defund their states of this subsidy income.
To a lesser extent, the same holds true of renewable energy tax credits for installation and production. Many of these renewable energy projects are concentrated in Republican states like Texas, Florida, North Carolina, and Arizona.
However, Columbia Threadneedle asserts that provisions like EV tax credits, charging station tax credits, emissions and energy efficiency standards, and certain specific clean energy funding is at high risk of being repealed in a Republican sweep.
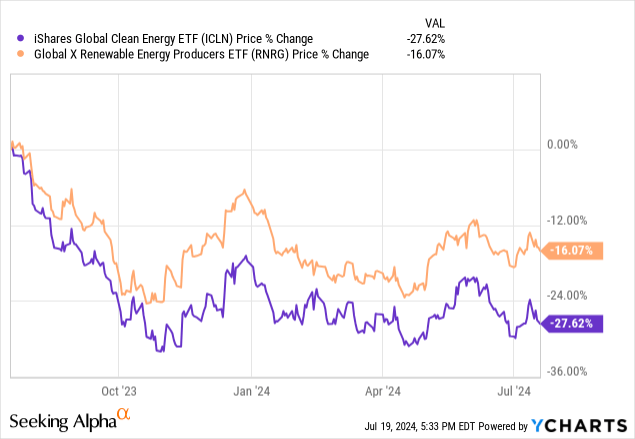
Of course, it is possible that renewable energy tax credits do get repealed, which would make operational projects less profitable and would slow the rate of development of new projects.
If that happens, expect even worse performance from the likes of the iShares Global Clean Energy ETF (ICLN) and renewable power asset owners such as those in the Global X Renewable Energy Producers ETF (RNRG).
But analysis from MIT Technology Review attests that behind the scenes, renewable power tax credits are much more popular with Republican lawmakers than they are publicly.
Morgan Stanley analysts echo this sentiment, arguing that subsidies for domestic manufacturing, wind & solar, and nuclear power enjoy bipartisan support and are unlikely to be repealed.
That’s why I am buying the dip on BEP and CWEN.A, which both own large portfolios of renewable energy assets.
Meanwhile, while the 6.5% yield of American Homes 4 Rent’s (AMH) series H preferred stock is not the highest yield you’ll find in the preferreds space, I believe it is highly likely to return to its par level of $25.
In fact, AMH.PR.H traded above $25 as recently as March 2024.
While the pref only has upside of about 5%, I believe that upside is highly likely to manifest in the relatively near future, which will give me an opportunity to sell the pref for a small gain and reinvest elsewhere.
Lastly, note that REXR just reported Q2 2024 earnings, and they were quite solid:
- Same-property NOI growth of 6.0% on a GAAP basis and 9.1% on a cash basis
- Same-property rent rates up 67.7% on a GAAP basis (inclusive of future rent escalations) and 49.0% on a cash basis
- Q2 core FFO per share growth of 11.1% YoY
- 1H core FFO per share growth of 10.4% YoY
- Occupancy of 96.9%
I continue to expect high-single-digit to low-double-digit growth from REXR despite the general slowdown in industrial real estate, largely because of REXR’s high-quality locations and building functionality.
Moreover, the pipeline of industrial real estate under construction in Southern California has now completely reverted back to its previous level and continues to drop.
REXR Q2 2024 Presentation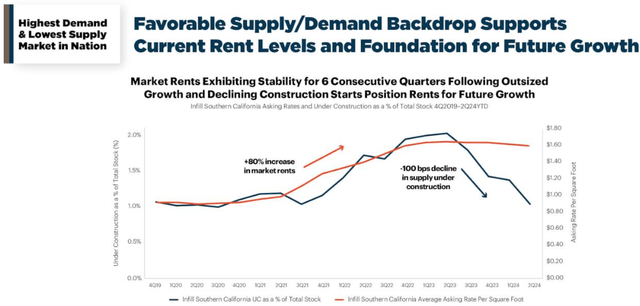
This as asking rents continue to stay steady. Infill industrial real estate in SoCal continues to enjoy some of the lowest vacancy rates in the country, averaging 3.9% in Q2, according to REXR.
An alternative to REXR for those who like the real estate but would prefer a higher yield is the REIT’s 5.875% Series B preferred stock (REXR.PR.B), which currently has about 15% upside to par value and offers a 6.7% yield. REXR’s two preferred stock series together account for only about 1% of its total capitalization, making them extraordinarily safe sources of high-yielding income coming from an investment grade (BBB+ and equivalent credit ratings) issuer.
REXR might be a surprising pick because of its exclusive focus on Southern California, through which most of the imports from Asia flow via the Port of Los Angeles. But keep in mind that REXR’s portfolio is overwhelmingly geared toward the local economy, not importers. Its average space size is 26,000 square feet, and its locations are better suited for last-mile deliveries than warehousing huge batches of goods for distribution across the country.
Read the full article here