


Earnings of FNCB Bancorp, Inc. (NASDAQ:FNCB) will most likely decline this year because of pressure on the net interest margin. On the other hand, loan growth and expense reduction will support earnings. Overall, I’m expecting FNCB Bancorp to report earnings of $0.81 per share for 2023, down 22% year-over-year. Compared to my last report on the company, I’ve reduced my earnings estimate for the year as I’ve decreased my margin estimate. The year-end target price suggests a high upside from the current market price. Additionally, FNCB Bancorp is offering a high dividend yield. Therefore, I’m maintaining a buy rating on FNCB Bancorp.
Deposit Migration Remains the Key Factor for the Margin
FNCB Bancorp’s net interest margin somewhat stabilized during the second quarter after plunging in the first quarter of the year. The stability is impressive because the company’s deposit mix continued to deteriorate during the quarter. Like most peer banks, FNCB Bancorp’s deposits have shifted from non-interest-bearing accounts to high-rate accounts as the rising rate environment has provided a greater incentive for fund migration. The chart below from the earnings presentation shows the trend of deposit migration.
2Q 2023 Earnings Presentation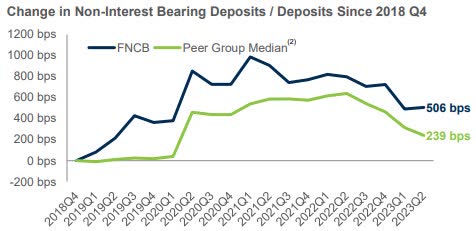
Further deterioration of the deposit mix is likely because I’m expecting a 25 basis points hike in the fed funds rate in the year ahead, which will increase the incentive for deposit migration. Also, the management has allowed a lower proportion of non-interest-bearing deposits in the past (end of 2018). Therefore, it’s unlikely that the company will take ameliorating actions, like running down its time deposits, to increase the proportion of non-interest-bearing deposits.
The results of the management’s rate sensitivity analysis given in the 10-Q filing show that a 200-basis points hike in rates could decrease the net interest income by 3.2% over twelve months.
2Q 2023 10-Q Filing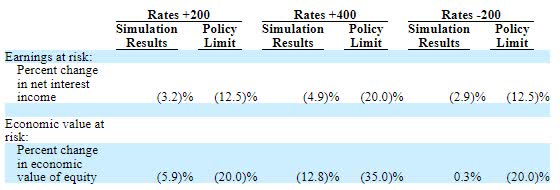
Considering these factors, I’m expecting the margin to dip by ten basis points in the second half of the year, leading to a full-year contraction of 67 basis points from the end of 2022. Compared to my last report on the company, I’ve decreased my margin estimate for 2023 because of the first half’s performance, which was worse than my expectation.
Local Economic Activity to Support Loan Growth
FNCB Bancorp’s loan growth continued to remain strong in the second quarter of the year. The portfolio grew by 3.1% during the quarter, which beat my expectations. Going forward, loan growth should decelerate from the second quarter’s level because of high-interest rates.
FNCB Bancorp operates in the Lackawanna, Luzerne, and Wayne counties of Pennsylvania. This state currently has one of the worst unemployment rates in the country, according to official sources. However, Pennsylvania’s economic activity is not bad. After faltering at the beginning of the year, the state’s economic activity is currently at par with the national average (compare the slopes of the trendlines below).
The Federal Reserve Bank of Philadelphia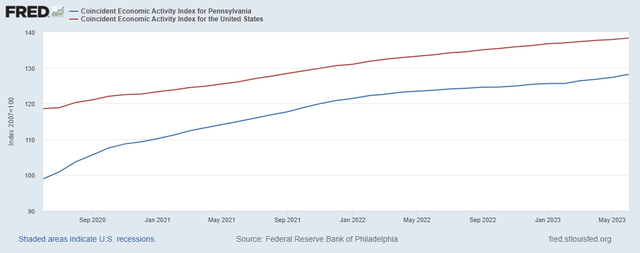
Considering the factors driving loan growth, I’m expecting the loan book to grow by 1.5% in each of the last two quarters of the year, leading to full-year loan growth of 10.2%. Further, I’m expecting other balance sheet items to grow in line with loans for the remainder of 2023. The following table shows my balance sheet estimates.
| Financial Position | FY18 | FY19 | FY20 | FY21 | FY22 | FY23E |
| Net Loans | 820 | 820 | 889 | 967 | 1,110 | 1,224 |
| Growth of Net Loans | 9.0% | (0.1)% | 8.5% | 8.8% | 14.8% | 10.2% |
| Other Earning Assets | 300 | 290 | 488 | 612 | 499 | 557 |
| Deposits | 1,096 | 1,002 | 1,287 | 1,455 | 1,421 | 1,521 |
| Borrowings and Sub-Debt | 34 | 57 | 10 | 30 | 182 | 249 |
| Common equity | 97 | 134 | 156 | 162 | 119 | 131 |
| Book Value Per Share ($) | 5.8 | 6.7 | 7.7 | 8.1 | 6.0 | 6.6 |
| Tangible BVPS ($) | 5.8 | 6.7 | 7.7 | 8.1 | 6.0 | 6.6 |
| Source: SEC Filings, Earnings Releases, Author’s Estimates(In USD million unless otherwise specified) | ||||||
Expecting Earnings to Plunge this Year
FNCB Bancorp has been quite impressive in restraining operating expenses over the first half of this year. Non-interest expenses dipped by 7.7% sequentially in the first quarter and then by 9.2% in the second quarter of the year. I’m not expecting further large declines in operating expenses because of inflation, which is still quite high even after the recent disinflation. Overall, I’m expecting an efficiency ratio (calculated as non-interest expenses divided by total revenue) of 62.6% for 2023, up from 57.2% in 2022.
A decline in operating expenses and loan growth will support earnings this year. On the other hand, margin pressure will drag earnings. Overall, I’m expecting FNCB Bancorp to report earnings of $0.81 per share for 2023, down 22% year-over-year. The following table shows my income statement estimates.
| Income Statement | FY18 | FY19 | FY20 | FY21 | FY22 | FY23E |
| Net interest income | 37 | 36 | 40 | 49 | 54 | 47 |
| Provision for loan losses | 2.6 | 0.8 | 1.9 | 0.2 | 2.0 | 2.8 |
| Non-interest income | 12 | 8 | 9 | 8 | 8 | 8 |
| Non-interest expense | 29 | 30 | 29 | 31 | 35 | 32 |
| Net income – Common Sh. | 13 | 11 | 15 | 21 | 20 | 16 |
| EPS – Diluted ($) | 0.79 | 0.56 | 0.76 | 1.06 | 1.03 | 0.81 |
| Source: SEC Filings, Earnings Releases, Author’s Estimates(In USD million unless otherwise specified) | ||||||
In my last report, I estimated earnings of $1.05 per share for 2023. I’ve reduced my earnings estimate mostly because I’ve slashed my margin estimate.
Securities Portfolio is the Major Source of Risk
FNCB Bancorp’s risk level appears moderately high mostly because of the securities portfolio. As interest rates have risen, the market value of these securities has fallen. The resultant unrealized mark-to-market losses on the Available-for-Sale securities portfolio amounted to $46.7 million, which is around a sizable 38% of total equity.
The loan portfolio is also responsible for FNCB’s moderately high-risk level. Firstly, it is not geographically diverse as most of the loan book is concentrated in just three counties of Pennsylvania. Moreover, real estate loans make up the majority of loans, at around 58%. Any upheaval in the local real estate market can have a large impact on the loan portfolio’s credit quality because of the concentration. However, currently, the credit quality is quite good. Non-performing loans made up just 0.31% of total loans at the end of the last quarter.
FNCB has not disclosed the amount of uninsured and uncollateralized deposits, so it’s difficult to judge the deposit book’s riskiness.
FNCB Offering an Attractive Dividend Yield
FNCB Bancorp is currently offering a high dividend yield of 5.9% at the current quarterly dividend rate of $0.09 per share. The earnings and dividend estimates suggest a payout ratio of 44.5% for 2023, which is much higher than the five-year average of 28.7%. Nevertheless, I think the dividend payout is secure because any company can easily maintain a payout ratio that’s less than half its earnings.
Moreover, the capital level is comfortable; therefore, the dividend is not under threat from regulatory requirements. FNCB Bancorp reported a total capital-to-risk-weighted asset ratio of 12.97% at the end of June 2023, as opposed to the minimum regulatory requirements of 10.50%.
Maintaining a Buy Rating
I’m using the historical price-to-tangible book (“P/TB”) and price-to-earnings (“P/E”) multiples to value FNCB Bancorp. The stock has traded at an average P/TB ratio of 1.08 in the past, as shown below.
| FY19 | FY20 | FY21 | FY22 | Average | ||
| T. Book Value per Share ($) | 6.7 | 7.7 | 8.1 | 6.0 | ||
| Average Market Price ($) | 7.9 | 6.4 | 7.7 | 8.4 | ||
| Historical P/TB | 1.17x | 0.83x | 0.96x | 1.39x | 1.08x | |
| Source: Company Financials, Yahoo Finance, Author’s Estimates | ||||||
Multiplying the average P/TB multiple with the forecast tangible book value per share of $6.6 gives a target price of $7.2 for the end of 2023. This price target implies a 17.2% upside from the August 18 closing price. The following table shows the sensitivity of the target price to the P/TB ratio.
| P/TB Multiple | 0.88x | 0.98x | 1.08x | 1.18x | 1.28x |
| TBVPS – Dec 2023 ($) | 6.6 | 6.6 | 6.6 | 6.6 | 6.6 |
| Target Price ($) | 5.9 | 6.5 | 7.2 | 7.9 | 8.5 |
| Market Price ($) | 6.2 | 6.2 | 6.2 | 6.2 | 6.2 |
| Upside/(Downside) | (4.4)% | 6.4% | 17.2% | 28.0% | 38.8% |
| Source: Author’s Estimates |
The stock has traded at an average P/E ratio of around 9.5x in the past, as shown below.
| FY19 | FY20 | FY21 | FY22 | Average | ||
| Earnings per Share ($) | 0.56 | 0.76 | 1.06 | 1.03 | ||
| Average Market Price ($) | 7.9 | 6.4 | 7.7 | 8.4 | ||
| Historical P/E | 14.1x | 8.4x | 7.3x | 8.1x | 9.5x | |
| Source: Company Financials, Yahoo Finance, Author’s Estimates | ||||||
Multiplying the average P/E multiple with the forecast earnings per share of $0.81 gives a target price of $7.6 for the end of 2023. This price target implies a 24.3% upside from the August 18 closing price. The following table shows the sensitivity of the target price to the P/E ratio.
| P/E Multiple | 7.5x | 8.5x | 9.5x | 10.5x | 11.5x |
| EPS 2023 ($) | 0.81 | 0.81 | 0.81 | 0.81 | 0.81 |
| Target Price ($) | 6.0 | 6.8 | 7.6 | 8.5 | 9.3 |
| Market Price ($) | 6.2 | 6.2 | 6.2 | 6.2 | 6.2 |
| Upside/(Downside) | (2.0)% | 11.1% | 24.3% | 37.4% | 50.6% |
| Source: Author’s Estimates |
Equally weighting the target prices from the two valuation methods gives a combined target price of $7.4, which implies a 20.7% upside from the current market price. Adding the forward dividend yield gives a total expected return of 26.6%. Hence, I’m maintaining a buy rating on FNCB Bancorp.
Read the full article here