


Written by Nick Ackerman, co-produced by Stanford Chemist
Franklin Universal Trust (NYSE:FT) is a closed-end fund that provides exposure to a portfolio of high-yield bonds and utility equity positions. There are a few CEFs that take a similar approach as FT, but FT leans more heavily in the fixed-income direction, with over 60% of the portfolio being allocated to that sleeve. The fund trades at a double-digit discount to its net asset value per share and delivers a monthly distribution to investors.
Since our last update, the fund’s discount has stayed more or less the same, but thanks to strong performance in the underlying portfolio, the fund has put up a respectable total return performance. In fact, the fund, despite its composition, has been able to compete against the returns of the S&P 500 Index during this time.
FT Performance Since Prior Update (Seeking Alpha)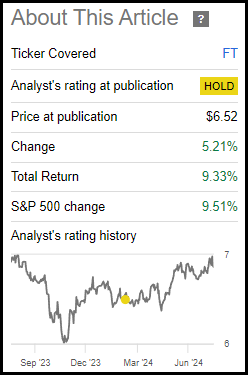
FT Basics
- 1-Year Z-score: -0.13
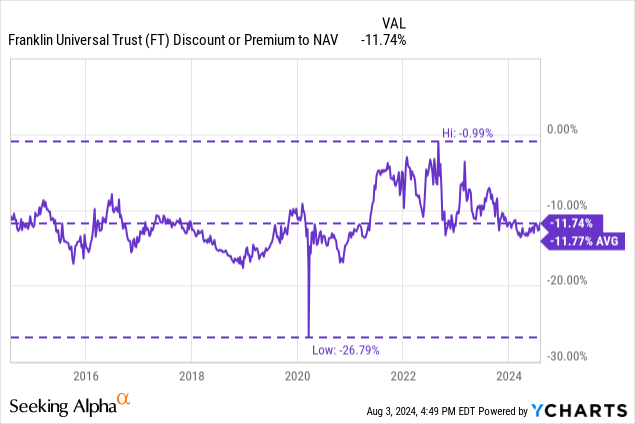
- Discount/Premium: -11.74%
- Distribution Yield: 7.43%
- Expense Ratio: 3.37% (including leverage expenses)
- Leverage: estimated 23.31%
- Managed Assets: $257.5 million
- Structure: Perpetual
FT’s investment objective is to “provide high current income consistent with preservation of capital. Its secondary objective is growth of income through dividend increases and capital appreciation.”
To achieve this, the fund will:
the Fund may invest in a significant portion of its portfolio in lower-rated U.S. debt securities that have high income producing characteristics, including obligations of corporations and other business organizations. Lower-rated securities generally pay higher yields than more highly rated securities to compensate investors for the higher risk. The Fund may also invest in income producing debt obligations of the U.S. Government, its agencies and instrumentalities, and foreign governments and supranational organizations. Under normal market conditions, the Fund generally will invest between 60% and 80% of its total assets in high income producing debt securities of U.S. and foreign issuers, allocated among issuers, geographic regions, and currency denominations in a manner that is consistent with its objectives based upon relative interest rates among various instruments denominated in different currencies, the outlook for changes in these interest rates, and anticipated changes in currency exchange rates.
They continue with:
the Fund will invest approximately 20% to 40% of its assets in dividend-paying common and preferred stocks. The Fund will emphasize investment in common stocks paying higher current dividends with a focus on public utility companies. The Fund may also invest in equity and convertible securities of companies engaged in the business of extracting and processing precious metals and natural resources, such as gold mining stocks.
The fund employs leverage, and it is a rather modest amount, but it does add to the fund’s total expense ratio. Higher interest rates caused their borrowing costs to rise across many leveraged CEFs. The 3.37% total expense was up from the 2.77% we saw at the end of fiscal year 2023. This was despite the fund’s fixed-rate costs. The fund had been paying 3.91% on senior notes; however, those were repaid, and they have started borrowing from a credit facility at 5.95% now. The credit facility will mature on September 14, 2026.
Leverage can add volatility and risks, so it is always something to consider before investing in a leveraged fund, but it can also add potentially greater returns as well.
Another consideration is that FT is rather small in terms of managed assets. That can add limited liquidity with relatively lower average daily trading volume, making it more difficult for a larger investor to get a meaningful position in the fund, or it can be difficult to try to exit at a rapid pace.
Performance – Deep Discount, But Rather Normal
When looking at CEFs, the discount is going to be one of the main factors to consider. However, while FT checks the box for a deep discount in terms of an absolute basis, the actual relative discount isn’t too much of a screaming bargain.
On a 1-year basis, the average discount has come in around 11.37%, which isn’t too far off from where the fund is currently trading. That’s why the fund’s 1-year z-score, a measurement of how close the fund’s discount is trading relative to its average during this period, comes in at around -0.74—which only indicates a mild relative discount.
Over the longer term, we see a similar relative valuation. The fund had experienced a bit of discount volatility for a couple of years in 2022 and 2023, where the discount actually narrowed a few different times quite meaningfully. However, the current level seems to simply bring the fund back to where it had usually been trading prior to this rather short period of time.
What might be more interesting is the fund’s exposure to utilities and high-yield bonds, which could benefit from rate cuts. With cooling inflation data becoming more of a trend once again, it looks like the Fed may be in a position to be able to cut rates this year and next. Of course, that will all be dependent on the data continuing that trend.
With rate cuts, the underlying portfolio could get a boost as utilities could look more attractive once again. The high-yield portfolio isn’t going to necessarily be that interest rate sensitive—as measured by the 2.79-year effective duration—but it can still be a positive.
When looking at the performance of this fund historically, they incorporate the benchmark of both the ICE BofA US High Yield Constrained Index and the S&P 500 Utilities Index. The fund’s performance has been able to outperform the high-yield component for most periods, but it has lagged against the utility benchmark. Given the fund is also employing leverage and these underlying indexes aren’t, it would appear that the results are nothing to get overly excited about, even if there is a bit of outperformance on the high-yield side.
FT Performance Vs. Benchmarks (Franklin Advisers)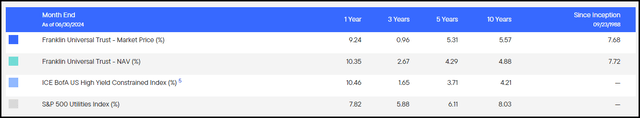
Distribution – Monthly Pay
FT pays a level monthly distribution to its investors; it currently works out to 7.43% and a reasonable 6.49% NAV rate.
FT Distribution History (Franklin Advisers)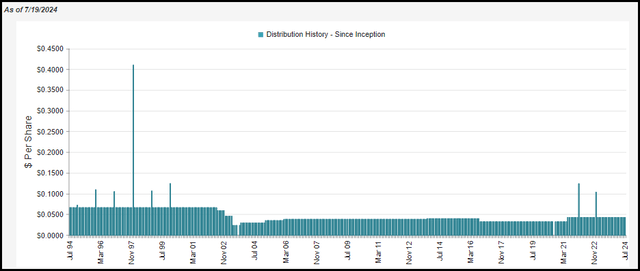
To cover the distribution, the fund will require some capital gains, as do most closed-end funds that also incorporate an equity component in their strategy. As of the last semi-annual report, the fund’s net investment income came in at $0.18. That put NII distribution coverage at around 70% during this period.
FT Financial Metrics (Franklin Advisers)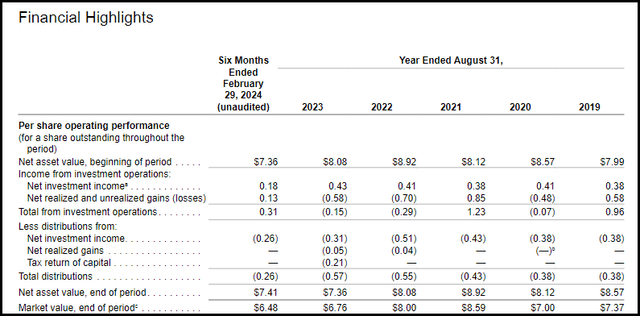
NII took a hit due to the higher borrowing costs that the fund is now experiencing after they refinanced at a higher rate. Being that they are borrowing at fixed rates still, this won’t be a fund that benefits right away from the potential rate cuts.
FT’s Portfolio
The fund’s latest portfolio turnover rate came in at 10.24%, which would put it on pace to exceed last year’s 17.73% if the trend continues. However, given the fund’s investment policy—despite being rather flexible—there is still a generally stable and predictable asset allocation to the fund. That is a heavier emphasis on the high-yield fixed-income sleeve of the fund.
FT Asset Allocation (Franklin Advisers)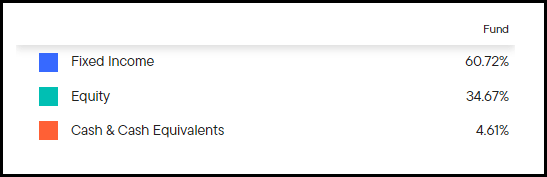
As we would suspect, with the fund’s investment policy of investing in “high-yield,” the vast majority of these securities are considered below investment grade. Only 3.78% is BBB, and the rest is rated lower—the “not applicable” here would be referring to the fund’s utility equity sleeve.
FT Fixed-Income Portfolio Credit Quality (Franklin Advisers)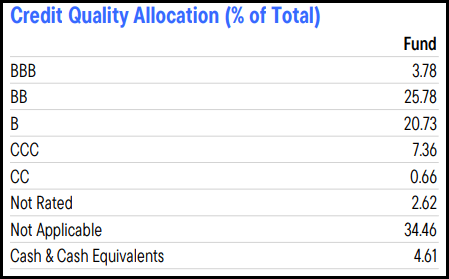
However, in this sleeve, it isn’t just high-yield corporate bonds that one might be familiar with. Instead, they also invest in marketplace loans. These only represent 4.2% of the fund’s assets as of their last semi-annual report, but there are hundreds of them. That’s what pushes this fund’s number of holdings up to 3091, according to CEFConnect.
At the same time, since there are hundreds of them and even many corporate bond holdings relative to the number of utility names, none of the fixed-income names make the top ten. Instead, despite the utility sleeve being the smaller component, the top ten are all equity utility positions.
FT Top Ten Holdings (Franklin Advisers)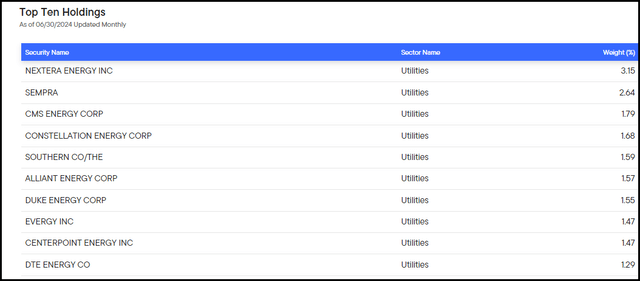
Conclusion
The fund trades at a substantial discount, but that is fairly normal for this fund, so it doesn’t appear to be a great bargain. The fund also hadn’t been able to provide any significant outperformance against its non-leveraged benchmarks. Combining both of these points would make FT appear to be nothing too special at this time. An activist could pressure the fund potentially to shake some things up and try to narrow that discount; however, there are no major positions by well-known activists at this time. For these reasons, I’d continue to see this fund as a ‘Hold.’
Read the full article here