


Tariffs – A Race to the Bottom, Why Take the Risks
Federal Reserve Chairman Jerome Powell, in his recent June 18 press conference, referred to tariffs as inflationary. While he may not have had the time to fully explain this statement, it needs to be noted that inflation is only the first-round effect. Second, third, and later-round effects also come into play, causing the quantity demanded and price to decrease for the goods subjected to tariffs. When retaliators respond by swiftly raising tariffs, as has been the case historically as well as this year, the micro-demand curves in the country that initiated the tariff increase, referred to as the “instigator country,” shift inward, and the benefit of hiking tariffs is lost. A substantial fall in the quantity demanded for the goods of export industries at home and abroad leads to a contraction in their total revenues. Soon, firms must make the difficult decision of whether to raise prices and lose market share or cut profit margins to maintain their market share. In addition, they will need to reduce their demand for the factors of production (labor, natural resources, and capital). These micro effects quickly domino into the macro-economy.
Quantifying The Microeconomic Effects
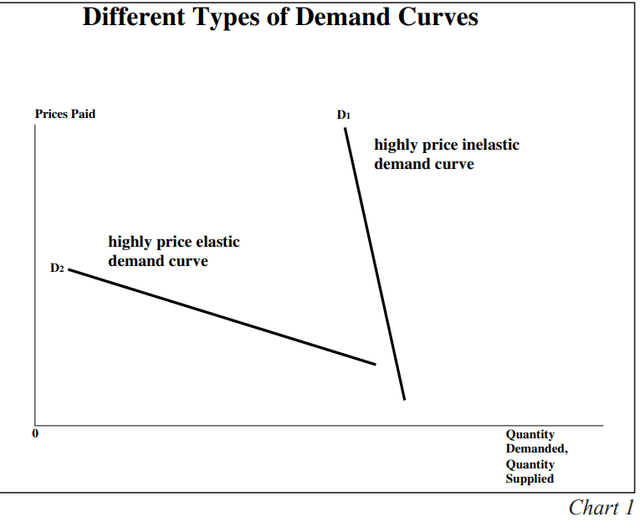
One of the crucial aspects of international goods is their high price elasticity of demand, a concept that plays a significant role in determining the deleterious effects of tariff wars. The slope of the demand curve for these goods is significantly different from that of price-inelastic goods, as illustrated in Chart 1. The concept of price elasticity of demand, which measures the responsiveness of the quantity demanded of a good to a change in its price, is determined by the availability of substitutes for those items, including time and the ability to repair or modify the existing stock. Autos, appliances, heavy trucks and capital equipment are examples of price elastic goods. In simpler terms, the “substitution effect” is determined by the speed at which buyers can adjust their behavior when the price of a product changes.
The greater the price elasticity of demand, the larger the drop in quantity demanded when an instigator country raises tariffs, and other nations retaliate. In this case, the total revenue, which is the quantity demanded times the prices paid by the export industries, will decrease significantly for firms with the most price-elastic demand.
First and Second-Round Effects
First round: The industry supply curve is upward sloping, reflecting the law of supply and the positive correlation between quantity supplied and prices paid. As such, the basic two-variable micro-model assumes that all other variables remain constant, a common feature with the two-variable macro model. In Chart 2, the position of the supply curve before tariffs are raised is depicted by S1, with equilibrium at point A. The imposition of tariffs shifts the entire supply curve upward and inward, as shown by S2 on this graph. S2 intersects the downward-sloping demand curve at point B. There is a movement along the demand curve that causes prices paid to rise from P0 to P1. The quantity demanded decreases from Q0 to Q1. This decrease in quantity demanded, often referred to as “demand destruction,” occurs when tariffs are increased, leading to a reduction in the amount of goods demanded. Total revenue falls sharply. The instigator country experiences price increases and falling demand at this instance, but this first round effect is temporary.
Second round: When foreign countries retaliate by raising tariffs, the demand curve in the instigator country shifts inward, causing the temporary equilibrium to move from point B to point C (Chart 2). The price level drops from P1 to P2, and quantity demanded falls from Q1 to Q2. Total revenue declines under the pressure of lower quantity demanded and prices paid, amplifying the negative effects of the initial tariff increase.
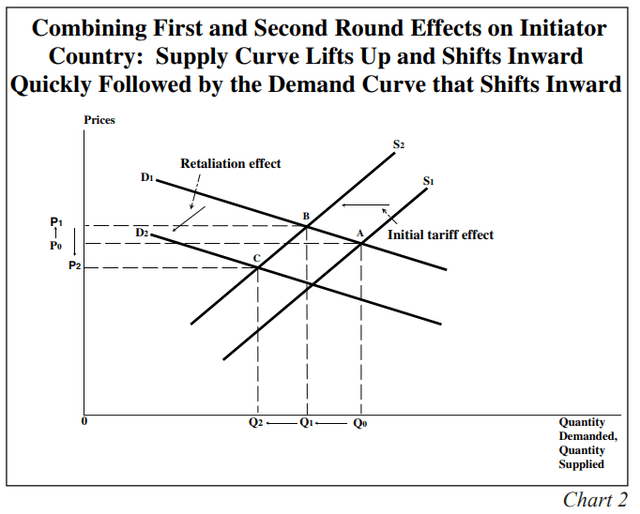
P2 is now below that of P0, or the prices paid before the instigator raised tariffs in the first place. Total revenues of domestic and global exporters fall even further, intensifying the margin squeeze on the producers. Lower revenue leads to a reduction in the demand for natural resources, labor, and capital—the three primary factors of production. The total quantity demanded and prices paid have fallen in response to the initiator hiking tariffs. At this point, the race to the bottom is underway, but additional negative knockoff consequences occur.
Aggregate Supply (AS) and Aggregate Demand (AD)
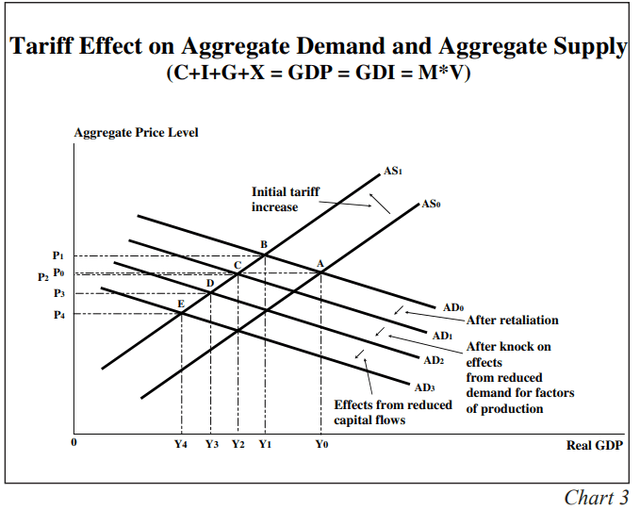
The AS curve is the sum of micro-supply curves, as output is always positively correlated with price (the law of supply). Economists, however, cannot sum micro-demand curves into AD curves since there are no relative price changes, which excludes the associated substitution effects from the AD/AS model. The AD curve slopes downward because it captures four other effects: (1) real disposable income varies inversely to aggregate price changes (“income effect”); (2) net exports vary inversely to price level changes (“net export effect”); (3) real household and business wealth (including the stock of money) varies inversely to price level changes (“wealth effect”); and (4) the decrease in real money balances will increase the real level of money and bond yields (“real interest rate effect”). This wealth effect, which was conceptualized by Arthur Cecil Pigou (1877-1959), the renowned classical economist and professor to J.M. Keynes, should not be confused with the wealth effect from stock market gains. These adverse side effects are triggered very quickly by increased tariffs in the instigator country.
From the pre-tariff increase to the post-tariff increase, the instigator country causes a shift from AS0 to AS1, with the equilibrium moving from point A to point B, as illustrated in Chart 3. Aggregate Price Level (P) increased from P0 to P1, and real GDP decreased from AD0 to AD1. When the retaliator responds, the instigator country experiences a decline in real GDP, as illustrated by downward shift from AD0 to AD1. The compounding negative effects of the retaliatory tariffs shift the AD curve further inward to AD2 and then AD 3, resulting in further declines in real GDP and aggregate prices.
The Kindleberger Spiral
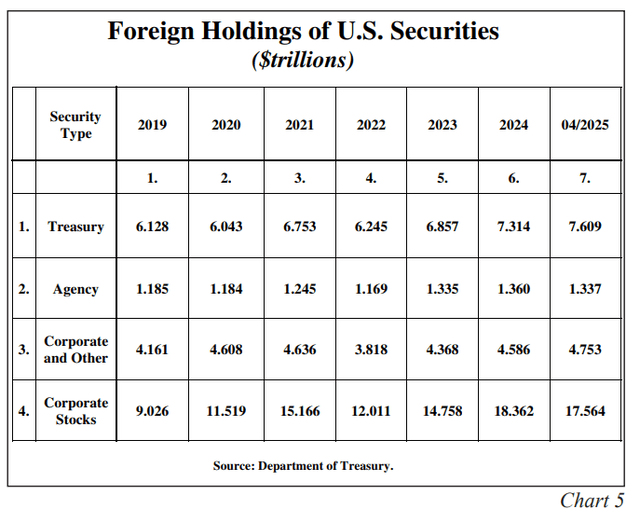
Declining international trade volume, which is one of the highest multiplier components of GDP for most countries, results in a further inward shift of the aggregate demand (AD) curve. Notably, net foreign investment (NFI – i.e., the capital account of the international account), which is the inverse of the current account decreases, as illustrated in the U.S. from 1948 through the first quarter of 2025 (Chart 4). Physical investment (I) equals saving (S), which has three components: private, government, and foreign. At the end of April 2025, foreign saving was distributed as follows: $17.6 trillion in U.S. equities, $7.6 trillion in U.S. Treasuries, $1.3 trillion in agency bonds, and $4.8 trillion in corporate and other debt (Chart 5).
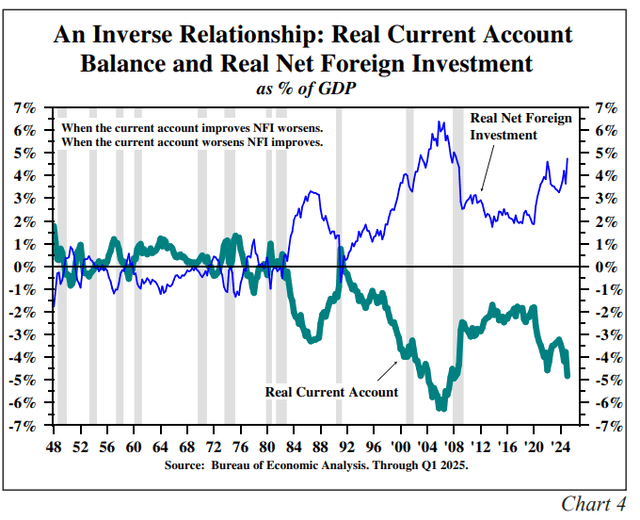
With tariffs reducing the current account deficit, liquidity will dry up. NFI, the thin line in Chart 4, will decline as the current account deficit is reduced. In turn, this will diminish the flow of funds into equities, Treasuries and other U.S. investments. If the Federal Reserve does not lower the Fed Funds Rate, this could lead to what is known as Kindleberger’s Spiral. This concept originated in Charles P. Kindleberger’s book, The World in Depression (initially published in 1973 and with a 40th-anniversary edition updated by highly recognized economists Bradford DeLong and Barry Eichengreen in 2013). Kindleberger’s book, Manias, Panics, and Crashes (1978), is world-renowned. International Economics (1953, followed by five more editions) was the dominant graduate-level text in its field for nearly half a century.
When beggar-thy-neighbor policies are widespread, Kindleberger showed that the central bank of the world’s reserve currency must provide liquidity to offset the loss caused by the sharp contraction in capital flows. If the Fed doesn’t step quickly into this leadership role, the risk of a Kindleberger Spiral increases significantly. In the 1920s and 1930s, the Bank of England was no longer capable of being the reserve currency because World War I had severely damaged the economic power of the British Empire, and the Federal Reserve did not fill the void that it had the capability of doing. The Powell Fed is currently on the sidelines watching this process unfold. Other leading central banks are lowering rates, but they don’t represent the world’s reserve currency. The Fed can fill the liquidity void and prevent the Kindleberger Spiral. GDP equals money (M) times velocity (V) in the equation of change. By algebraic substitution, AD equals M x V. As such, the Fed could shift the AD curve outward and begin to contain the race to the bottom.
Why Take the Risk of Raising Tariffs?
In addition to the risk of boosting tariffs previously discussed, another consideration for many is David Ricardo’s “law of comparative advantage,” which is the benefit accruing to all countries that engage in international trade, even if a country does not have the lowest total cost of producing a good. However, for this benefit to work, all countries engaging in trade must allow Adam Smith’s “invisible hand” to prevail. But the world has many mercantilists, some of whose practices result in massive intrusions on the “invisible hand,” which, in turn, have hollowed out the U.S. industrial base to the benefit of other countries. As demonstrated by the supply chain disruptions caused by the Pandemic and the Russian-Ukrainian War, the U.S. experienced severe shortages of drugs, medical equipment, and a host of other products that could not be produced domestically. Command and control dominate free markets in these mercantilist economies. Thus, by hollowing out the U.S. industrial base, the world’s resources are being more inefficiently distributed, and thereby reducing the capacity of the global economy to raise its standard of living.
Since negotiations have consistently failed to reverse this situation, tariffs, despite their negative effects, remain the only viable tool to create a more strategically diversified industrial economy and to move the world back toward a more efficient allocation of its resources.
Fiscal Considerations
The One Big Beautiful Bill Act (OBBBA) which recently passed into law will not fill the demand loss created by multiple rounds of beggar-thy-neighbor actions and will have a negligible impact on the near-term trend in economic growth. Moreover, under OBBBA, a worsening Federal debt overhang will further diminish the longer-term growth prospects of the U.S. economy and more than offset the beneficial aspects of OBBBA.
Fiscal Effect: The baseline or official numbers calculated by the Congressional Budget Office assumed that tax rates, both household and corporate, would rise by $3 trillion over the next ten years, as the tax reductions enacted in 2016 were set to expire. If these taxes were to revert to the 2016 level, the U.S. economy would likely spiral into a deep recession, and the rest of the world would likely follow suit. Except for a few bells and whistles, OBBBA is a continuation of the current tax rates. The net fiscal stimulus amounts to only $30 billion per year, or $300 billion for the ten years. Such an amount could be offset by the tariff revenues that were running close to a $300 billion annual rate in the latest month. The savings are unlikely to yield the Administration’s estimates, but they will further reduce the deficit. Even if the tariffs and Doge yield no savings, $30 billion is a small rounding error for an economy with a GDP of $30 trillion. Suppose the tariffs are sustained at current levels, and DOGE is a positive factor. In that case, there is a slight fiscal drag, but one that is inconsequential given the national debt overhang.
Long-term effect: Under OBBBA, the long-term debt problem worsens dramatically even under projections for economic growth that are excessively optimistic. The standard of living for the past twenty years has fallen about 40% from the historical trend rate of growth from 1870 to 1970. Diminishing returns combined with the deadweight loss from increasing interest expense will further erode the growth rate in the standard of living.
Concluding Thoughts
To offset the contractionary effects of tariffs, the Fed needs to be quickly moving to an accommodative policy in order to avoid initiating a Kindleberger Spiral. The tariff wars are causing greater than normal noise and confusion in the economic news. The Fed will be ill advised to wait for the implications of a long-delayed downturn in net foreign investment (NFI) in the U.S. to be evident. Complicating matters is that NFI has been massively distorted by the front-running of the tariff increases and it has never been a focus of Federal Reserve policy discussions. While inflation will likely rise over the near term it will be temporary. The far more critical consideration is the coming contraction in global economic activity. This environment is very attractive for long horizon investors in long-term Treasury bonds.
Van R. Hoisington | Lacy H. Hunt, Ph.D.
|
Disclosures Hoisington Investment Management Company (HIMCo) is a federally registered investment adviser located in Austin, Texas, and is not affiliated with any parent company. The information in this market commentary is intended for financial professionals, institutional investors, and consultants only. Retail investors or the general public should speak with their financial representative. Information herein has been obtained from sources believed to be reliable, but HIMCo does not warrant its completeness or accuracy; opinions and estimates constitute our judgment as of this date and are subject to change without notice. This memorandum expresses the views of the authors as of the date indicated and such views are subject to change without notice. HIMCo has no duty or obligation to update the information contained herein. This material is intended as market commentary only and should not be used for any other purposes, including making investment decisions. Certain information contained herein concerning economic data is based on or derived from information provided by independent third-party sources. Charts and graphs provided herein are for illustrative purposes only. This memorandum, including the information contained herein, may not be copied, reproduced, republished, or posted in whole or in part, in any form without the prior written consent of HIMCo. |
Original Post
Editor’s Note: The summary bullets for this article were chosen by Seeking Alpha editors.
Read the full article here