

Investment Thesis
Investors in small-cap value stocks had a tough first half of the year, at least relatively speaking. Based on total returns of 437 U.S. Equity ETFs across 12 size and style categories, small-cap value ETFs delivered a median 4.99% from January to June 2023, the second-worst result and 23% lower than the typical large-cap growth ETF. However, none had it worse than the iShares US Small Cap Value Factor ETF (BATS:SVAL). The reason is that this relatively unknown fund heavily invests in the Financials sector, including 33% exposure to Regional Banks, and is unlikely to change gears anytime soon. Some might call it an opportunity, but I consider it trying to time the bottom. Since there is little to like about SVAL’s methodology or fundamentals apart from a cheap valuation, I don’t recommend buying, and I look forward to explaining why in further detail below.
SVAL Overview
Strategy Discussion
SVAL launched on October 27, 2020, and tracks the Russell 2000 Focused Value Select Index. According to the Index Ground Rules, the Index selects 250 small-cap stocks using the following approach:
1. The selection universe is the Russell 2000 Index.
2. A risk screen excludes the 20% most volatile securities over the last year based on realized volatility of daily total returns.
3. A leverage screen excludes the 20% most levered securities, calculated by dividing a company’s total debt by total assets.
4. A sentiment screen excludes companies with a negative sentiment score, defined as ones with more negative current or next year earnings per share estimates than positive estimates.
The remaining securities have composite scores calculated based on three valuation factors, with the top 250 qualifying:
- TTM Cash Flow / Market Capitalization (60%)
- TTM Net Income / Market Capitalization (30%)
- Book Value / Market Capitalization (10%)
This traditional value approach should always result in attractive price-cash flow, price-earnings, and price-book value ratios. The volatility and leverage screens seem reasonable, but I’m most interested in seeing what its sentiment screen yields. As you may know, Seeking Alpha has a comprehensive system to measure short- and long-term earnings revisions, and it will be nice to see how the two match up. But first, let’s look at performance.
SVAL Performance
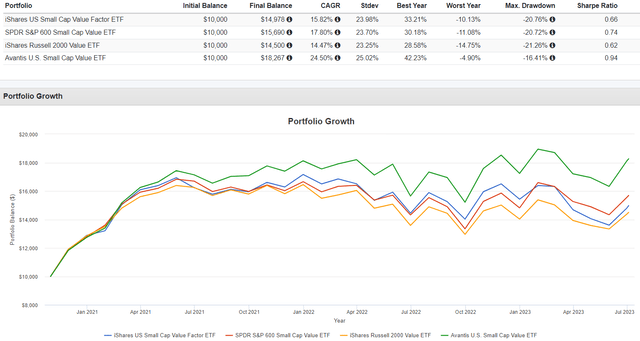
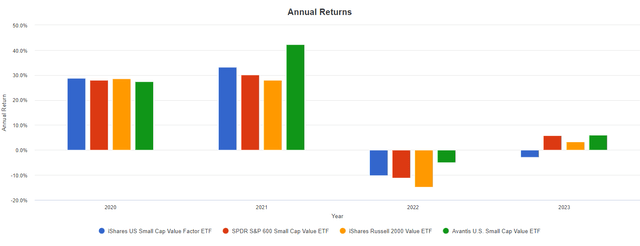
SVAL’s history is limited, so I’m careful not to write it off based on its results from the last three years. Still, it’s lagged behind passive alternatives like the SPDR S&P 600 Small Cap Value ETF (SLYV) by an annualized 1.98% and active funds like the Avantis U.S. Small Cap Value ETF (AVUV) by 8.68% per year. SVAL beat its benchmark, the iShares Russell 2000 Value ETF (IWN), by 1.35% per year, but IWN is also one of the worst-performing small-cap value funds in the last ten years.
Portfolio Visualizer
It’s hard to ignore these results but to be fair, the underperformance is mainly attributed to this year. SVAL is down 2.91%, while SLYV, IWN, and AVUV are up 5.92%, 3.39%, and 5.98%. Market participants have favored the growth factor to date, so we should see some weakness in that factor later in the fundamental analysis.
Portfolio Visualizer
SVAL Analysis
Sector Exposures and Top Ten Holdings
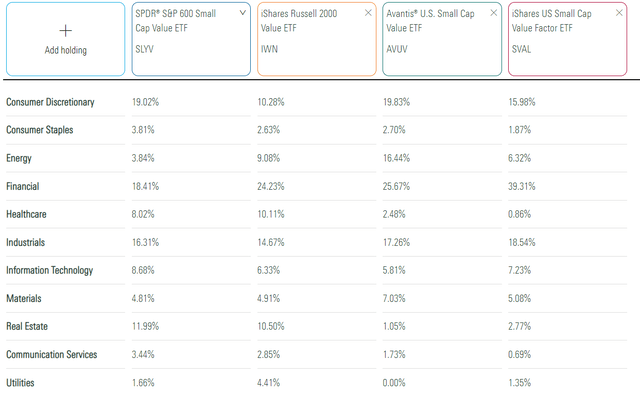
The following table highlights SLYV, IWN, AVUV, and SVAL sector exposures. Here, we see a potential flaw in SVAL’s approach: Financials is at 39.31%, indicating no sector weighting cap. To add to the concentration problem, SVAL’s Index does not evaluate securities by sector. Since Financial sector companies typically trade at lower valuations, they’re more likely to qualify.
Morningstar
SLYV and IWN are much more balanced, so that should result in more predictable results year-to-year. AVUV is also, but it’s actively managed, so nothing stops its managers from overweighting any sector they feel is undervalued.
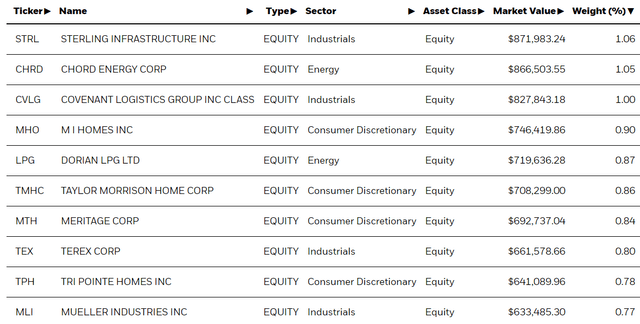
I’ve listed SVAL’s top holdings below. They total 8.93% and include 1% exposure to Sterling Infrastructure (STRL), Chord Energy (CHRD), and Covenant Logistics Group (CVLG). However, this list is not representative of SVAL’s composition. No Financials stocks are listed, though there are 108 in total, including 92 Regional Bank stocks comprising 33% of the portfolio.
iShares
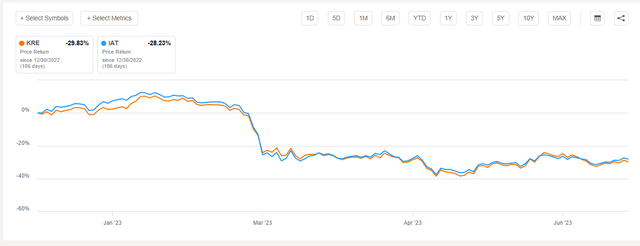
Based on archived versions of SVAL’s fund pages, it’s always been a Financials-heavy fund. For example, in January 2021, exposure was 43%. It topped 47% in August 2022 and then declined to 39% after the Regional Banking crisis. SVAL is a bet on this sector’s recovery, but if that’s your primary reason for investing in this fund, I encourage you to check out KRE, KBE, and IAT instead. These funds provide dedicated exposure to bank stocks, so it’s a more efficient use of capital.
SVAL Fundamentals By Industry
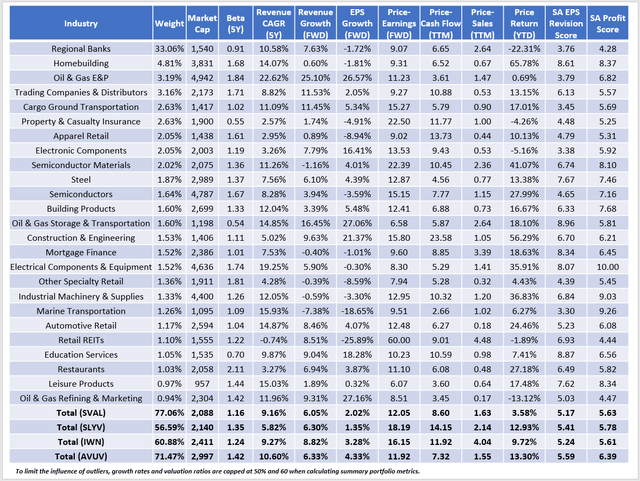
The following table highlights selected fundamental metrics for SVAL’s top 25 industries, totaling 77% of the fund. I’ve also included summary metrics for SLYV, IWN, and AVUV in the bottom rows.
The Sunday Investor
As discussed earlier, Regional Banks dominate SVAL at 33.06%, followed by Homebuilding (4.81%), Oil & Gas E&P (3.91%), and Trading Companies & Distributors (3.16%). The $2.09 billion weight average market capitalization figure is slightly below the peers listed, but that’s primarily due to the poor showing of Regional Bank stocks this year. SVAL’s Regional Bank stocks are down 22.31%, similar to the losses delivered by KRE and IAT.
Seeking Alpha
SVAL’s constituents have a 1.16 weighted average five-year beta, lower than most value peers. That’s likely the result of the initial screen its Index does, which removes the top 20% most volatile stocks over the last year. The Index’s focus on traditional valuation metrics is evident here. It screens for trailing earnings, but SVAL trades at just 12x forward earnings, four- and six-points cheaper than IWN and SLYV. Still, AVUV is more affordable on forward earnings, trailing cash flow, and trailing sales. It’s an excellent alternative to SVAL if you don’t mind a more concentrated fund.
All four ETFs have poor estimated sales and earnings growth rates. However, SVAL is the weakest at 6.05% and 2.02%. It’s no surprise why it’s performed poorly in this growth-favored market. I prefer a portfolio that scores reasonably well on all the abovementioned factors. SVAL might be part of that strategy if you want to drastically reduce your portfolio’s valuation. Still, it’s easy to do so with a Financials-focused ETF, so I’m not seeing much value-add.
Lastly, SVAL’s constituents do not appear to have good earnings momentum, based on its weak 5.63/10 Seeking Alpha EPS Revision Score. Again, Regional Banks are the key culprit, with a weighted average 3.76/10 score. I assumed they shouldn’t even be in SVAL in the first place, but this result raises a red flag. To confirm, I looked at the net next year’s fiscal year earnings revisions for SVAL’s top 15 holdings in that industry. Below are the results.
- Stellar Bancorp (STEL): +2 (3 Up, 1 Down)
- Simmons First National Corp. (SFNC): -5 (0 Up, 5 Down)
- City Holding (CHCO): +2 (3 Up, 1 Down)
- BancFirst (BANF): -2 (1 Up, 3 Down)
- Hilltop Holdings (HTH): +2 (3 Up, 1 Down)
- Home BancShares (HOMB): -2 (2 Up, 4 Down)
- OFG Bancorp (OFG): +2 (3 Up, 1 Down)
- First BanCorp / Puerto Rico (FBP): 0 (2 Up, 2 Down)
- S&T Bancorp (STBA): -5 (0 Up, 5 Down)
- Texas Capital Bancshares (TCBI): -5 (4 Up, 9 Down)
- 1st Source (SRCE): -3 (0 Up, 3 Down)
- Old Second Bancorp (OSBC): -5 (0 Up, 5 Down)
- TrustCo Bank Corp NY (TRST): -1 (0 Up, 1 Down)
- First Financial Bancorp (FFBC): -5 (0 Up, 5 Down)
- Community Trust Bancorp (CTBI): -2 (0 Up, 2 Down)
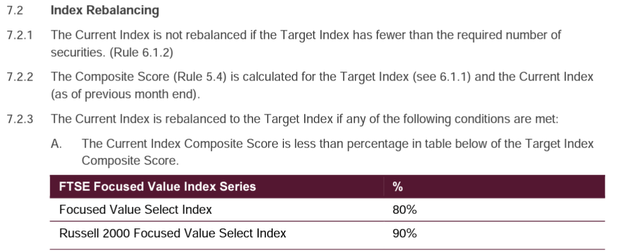
The net score is -27, or 1.8 negative revisions per company, so I’m surprised they still managed to qualify. On that note, SVAL is unique because it doesn’t rebalance on a fixed schedule. According to the Index Ground Rules, the Index rebalances only when the Current Index’s Composite Score is below 90% of the Target Index’s Composite Score.
FTSE Russell Indices
Although it’s hard to forecast when the next rebalancing might occur, the fact that Regional Bank stocks remain prominent speaks volumes. In the fund’s latest annual report for the period ending March 31, 2023, management acknowledged the challenges facing the banking industry:
The sudden failure of two regional banks late in the reporting period further pressured bank stocks, leading to government intervention to cover depositors and prevent a contagion effect. Despite government actions to contain the impact, these bank failures weighed heavily on the industry, as markets digested the long-term implications of the disruption.
If these bank failures weren’t enough to trigger a rebalancing, I’m not sure what will. SVAL’s portfolio turnover ticked up for the latest fiscal year to 71% from 14% and 13% from 2021-2022, but evidently, that wasn’t enough to take Regional Banks out of the equation.
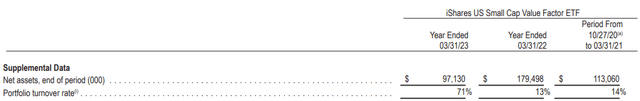
SVAL Annual Report
Investment Recommendation
SVAL’s reliance on the Financials sector explains much of this year’s underperformance. Unfortunately, there is little evidence to suggest that will change going forward:
- Despite a crisis, SVAL still has 33% exposure to Regional Banks
- The Index does not have any sector weighting caps.
- The Index is biased toward this traditionally cheaply-valued sector.
You might find SVAL appropriate to decrease your portfolio’s valuation by increasing exposure to the Financials sector. Still, it is risky and unbalanced, especially in growth potential and earnings momentum. Therefore, I don’t recommend buying SVAL, but I look forward to discussing it and other small-cap value alternatives in the comments section below.
Read the full article here