


Thesis
One of the strongest arguments for the inclusion of REITs in a broader portfolio is to guard against inflationary conditions. This justification is backed up by some level of common sense; the replacement value of real estate goes up in an inflationary environment because the costs to replace a building by nature of inflation are also up. It is fairly easy to get behind that argument, the logic is simple and intuitive.
Armed with this logic, historical data and the added justification of lower risk, investors allocate a plot of their portfolio to REITs and move on. But REITs are not exactly the same as real estate, historical data is only a sample and risk has many facets.
Through this article we will evaluate Vanguard Real Estate Index Fund ETF Shares (NYSEARCA:VNQ) through different lenses to assess whether it really makes sense as a core holding. Our analysis is based on data from 2005 (first full year for VNQ) through to June 2023. While the ideal sample size is always larger, this should be sufficient to capture a number of scenarios including two significant market events, changing interest rates, and varying levels of inflation.
Inflationary Protection
According to Russell Investments, different assets perform differently depending on the level of inflation as well as the level of growth. While we certainly agree, in all practicality investors are looking to ensure a portion of their portfolio performs well in inflationary environments and are unlikely to be constantly changing allocations depending on the inflation level. Given this implementation we will assess some suggested equity based asset classes for hedging inflation. Within this assessment we will not be looking at fixed income, direct commodities or private asset classes.
Russell Investments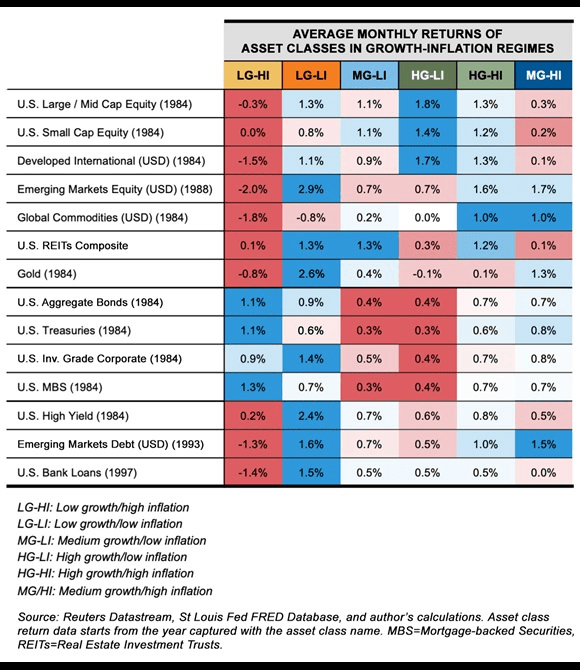
Asset Classes:
-
US REITs: Represented by VNQ
-
US Equity Market: Vanguard Total Stock Market Index Fund ETF (VTI)
-
US Growth Equities: Vanguard Growth Index Fund ETF (VUG)
-
US Value Equities: Vanguard Value Index Fund ETF (VTV)
-
US Non-Energy Commodity Equities: Vanguard Materials Index Fund ETF (VAW)
-
US Energy Equities: Vanguard Energy Index Fund ETF (VDE)
The inclusion of the broader market is set as a baseline for general equity protection against inflation, an asset class offering a nominal increase in inflation protection is probably not justified in holding a separate position all else equal.
Value stocks have historically outperformed growth during times of inflation, we introduce these two ETFs, VUG and VTV, to assess whether this still holds.
Non-energy commodity equities as well as energy equities are included as they are also often suggested, similar to real estate, to be strong inflation hedges and will be good direct comparisons for VNQ.
Our approach to assessing inflation protection will be to calculate the correlation coefficient between the ETF’s monthly return and the Consumer Price Index for All Urban Consumers from Jan 2005 through to June 2023 (n=222 for each ETF). This period reflects multiple major economic events. We will define inflation protection as having the highest correlation with inflation. Additionally we will include a correlation coefficient static between the trailing 12 months of returns and inflation (n=211). Given that inflationary data is not fully known during the month in which we record the return, a rolling 12 month period of returns could better reflect inflation data and smooth out some of the noise.
For those who haven’t looked at statistics in a while, the correlation coefficient is used to measure the linear strength between two variables. 1.0 is a perfect positive correlation and -1.0 is a perfect negative correlation.
Author’s Analysis
While VNQ does provide a higher correlation to inflation than the broader market and growth equities, it fails to compete with value, materials and energy. We see hardly any value in holding VNQ for inflation protection purposes and strongly encourage investors to maintain a broad market exposure or if inflation is a high concern, allocate a small portion of their portfolio to overweight energy.
Interestingly enough we do confirm the notion the value stocks tend to perform better in times of higher inflation. In fact growth stocks tend to have a negative relationship with inflation. We are seeing this lately as inflation has somewhat cooled in 2023, the value/growth favoritism has flipped from 2022 and put growth as the preference.
For any investor that owns their primary residence, the extremely marginal benefit to inflation provided by VNQ is likely not worth the additional allocation to real estate. For those investors without other real estate exposure in their portfolio, the value of VNQ could be a bit more beneficial. However if inflation is your primary objective in having a REIT allocation, we would suggest considering other alternatives or selecting individual REITs that more mimic your specific inflation risk.
Risk
There are many ways to assess risk but ultimately we would encourage all investors to further evaluate risk within the context of their own portfolio and objectives. That being said, we can analyze how VNQ has performed against some other commonly held and inflation protected securities.
Similarly to the correlation analysis our dataset includes monthly returns from Jan 2005 to June 2023 (n=222).
Author’s Analysis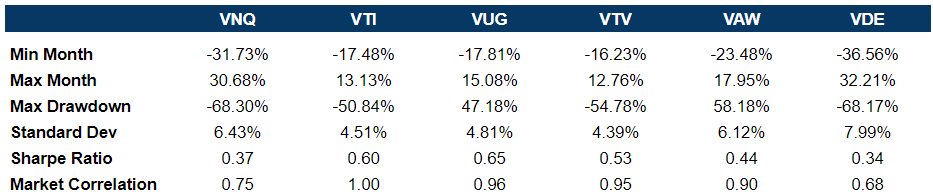
-
Market Correlation: This is the standout measure for VNQ, beating out the broader market, growth equities, materials. Energy represented by VDE provides the lowest correlation to overall US equities. Should an investor’s portfolio only consist of listed US equities, there is at least some level of argument for a VNQ position to diversify.
-
Min/Max Month and Max Drawdown: Here is where the metrics start to fall apart for VNQ. It sports the second worst month and the worst of the max drawdown. The max month is the second highest but when combined with low minimum months points to higher volatility. We would highlight this to investors that although VNQ may diversify portfolios it will do so at the cost of large swings. These are particularly dangerous for investors who exhibit behavioral biases and run the risk of exiting their position before the rebound.
-
Standard Deviation: As expected from the above bullet but likely a surprise to many investors, VNQ has a high standard deviation only less than energy. When people think of REITs they typically think of slower growing safer equities, but that is not the case in our data set. The standard deviation is noticeably higher than the broader market, an additional cost for holding VNQ.
-
Sharpe Ratio: Higher volatility can be worthwhile if investors are compensated for that risk. The Sharpe ratio is a measure of the return after adjusting for risk. Evident by the data above, investors are not fully being compensated for their additional risk. Narrowly beating out VDE, VNQ once again showcases limited justification.
Caveats
-
VNQ has a mix of many different types of REITs and some REITs are likely to be better inflation hedges than others.
-
Every investor’s portfolio is different and VNQ may have a place depending on the other assets and investor holds.
-
Underlying causes of inflation (CPI) can have different results on asset classes, what may have been a good hedge historically may not be a good one going forward.
Conclusion
Based on our analysis of the inflationary protection and risk attributes VNQ would add to a portfolio, we would recommend investors avoid adding VNQ to their portfolios. The very marginal inflation protection combined with largely undesirable volatility are likely to be more detrimental to investors (especially though managing their own portfolios and subject to biases) than they are worth.
Read the full article here