


Dear Partners:
I hope that you are doing well. When I joined Fidelity Investments in 2001, Fidelity had just recently fired a few of its senior Value Portfolio Managers and replaced them with Growth Analysts who “got” the then-current market. As the bursting bubble soon made a mockery of that decision, I wondered how the senior management could have been so foolish. They literally top-ticked The Bubble.
Now, after over 20 years of experience, living through the current market environment makes me realize how human the decision to fire the Value PMs was. When the crowd keeps behaving a certain way for a long time, it’s only human to start believing that it’s right. We are programmed that way. That’s why it requires a nearly inhuman temperament to stand apart from the crowd in investing and pursue decisions not based on the prevailing wisdom of the day but on your own, first-principles, analysis of the facts.
One of you reached out to me recently with a question that, together with my answer, I want to share with all of you. The question was as follows:
I’m looking at my asset allocation and also the managers with whom I work. Would you please provide me with the performance since I became an investor in the fund?“
It’s a fair and relevant question, since it covers a period of seven years, certainly not a short-term period of time. Here is my answer:
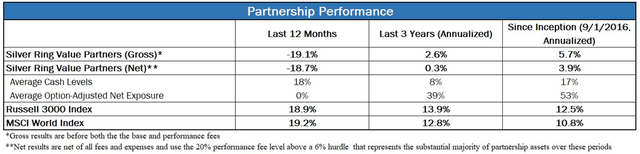
Annualized returns through the end of May were 4.9% net. These are clearly bad results. No excuses, but some context:
- I have stuck and will continue to stick to my investment process which prioritizes the safety of the principal and leads me to seek investments with a large margin of safety that have lagged in this market
- We haven’t had a full market cycle, and are currently ending in an end-point where the kind of stocks that I typically don’t invest in is valued very highly, while the smaller, out-of-favor special situations that we own are particularly marked down
- Our portfolio is currently very undervalued, with our securities on average below 60% of my estimate of value
I strongly believe that my process works and that over a full cycle, it will deliver good results in excess of the market with low risk. There are obviously no guarantees in life, but most of my family’s capital is in the partnership based on that belief.
Also, while I am always trying to improve, I am not going to fundamentally change how I approach investing to chase performance or to try to catch up with markets at the risk of losing our money, or anything like that. So no AI stocks, crypto, or stocks that are supposedly deeply undervalued at 40x-50x EPS for me. If you decide to continue trusting me with your capital, as I hope you do, I want you to know exactly what you can expect, for better or for worse.“
Investment Activity
I did not add or exit any investments during the quarter. I am currently researching a couple of companies as potential new investments. However, the high bar for deploying our capital remains unchanged. The combination of quality and a deep discount from intrinsic value remains difficult to find in this market environment, and compromising on either would be a mistake.
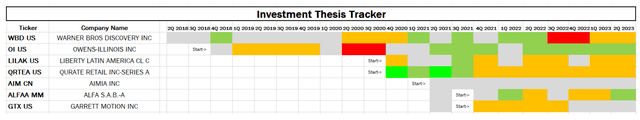
- Light Gray: thesis is tracking roughly in line with my base case
- Orange: thesis is tracking somewhat below my base case
- Red: thesis is tracking significantly below my base case
- Dull Green: thesis is tracking somewhat better than my base case
- Bright Green: thesis is tracking significantly better than my base case
- White: No data
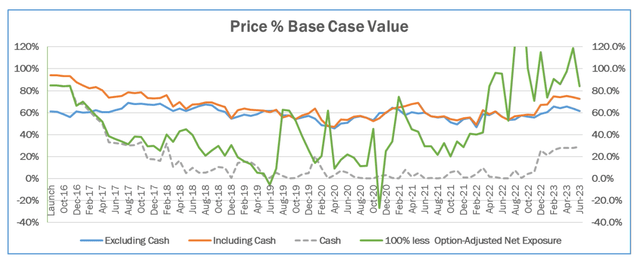
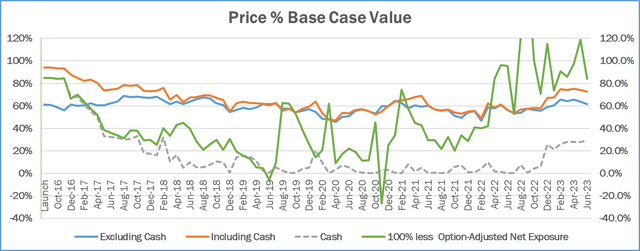
- The portfolio was priced at 73% of Base Case value and at 61% excluding cash at the end of Q2
- Option-adjusted net exposure was at 16%, reflecting option-based hedges
- Excluding the inflation hedges, option-adjusted net exposure would have been 49%
- Cash and equivalents were 29% at the end of the quarter, and weren’t a reflection of market timing, but rather a temporary residual of the bottom-up investment process
Portfolio Update
What Do the Best Investors Do That the Rest Don’t?
Charlie Munger, the Vice Chairman of Berkshire Hathaway and Warren Buffett’s partner said something simple yet profound at the 2017 Berkshire Hathaway Annual Meeting: “A lot of other people are trying to be brilliant and we are just trying to stay rational. And it’s a big advantage.” Some might think that becoming an excellent investor requires off-the-charts intelligence or some highly proprietary model that leads to an edge that nobody else can replicate. That is not what experience has shown.
Here are some traits and behaviors that have allowed investors to excel over the long term:
- Temperament. Temperament is the most important quality for an investor to have. My observation of many investors over my 22 years of professional investing has led me to believe that temperament cannot be learned, but rather it is an innate characteristic of one’s personality. Some people are able to remain rational and continue to follow their process even under great duress or during periods of external upheaval. Others get swept up in the emotion that typically runs amok during such circumstances and abandon their discipline.
- Ability to do nothing most of the time. Most of the time there are few good investments that combine sufficient business quality with a large margin of safety in the form of a large gap between price and intrinsic value. That doesn’t mean that great investors are spending all of their time relaxing on the beach – to the contrary, they are typically voraciously reading and studying business and industries, preparing for the moment when securities of companies they understand well can be purchased at attractive prices. It does mean that they make investments infrequently and that most of the time when they look at a potential opportunity, they end up passing. Those who are unable to maintain this state of low activity frequently end up making questionable investments to satisfy their desire to do something, and more often than not it is their brokers who are the biggest beneficiaries of their elevated activity levels.
- Accumulation of mental models. Understanding different disciplines helps great investors look at questions of business analysis in new ways. While studying economics and industry-specific information can certainly help, the best investors also use insights from other fields to reach better decisions.
- Focus on process over outcome. Benjamin Graham wrote: “In the short-term, the market is a voting machine, but in the long-term, it is a weighing machine.” What he meant was that in the short-term security prices fluctuate purely based on the opinions of market participants, and can deviate widely from the underlying business values. In the long term, it is the company’s assets and cash flows that determine its value and exert a force of gravity upon the price of its securities. With security prices available on a minute-by-minute basis, the run-of-the-mill investors focus on analyzing randomness – allowing themselves to become happy or sad over short-term price fluctuations that are disconnected from whether they were fundamentally right in their investment analysis. The best investors work hard to not be affected by the short-term price fluctuations, and instead focus on both improving their process and consistently executing it. Over the long term, their performance is a result of the quality of their process and of the consistency with which they execute it.
- Minimizing behavioral biases. Behavioral biases are pervasive and nearly impossible to eliminate, but the best investors work hard to be consciously aware of them and to take specific steps to mitigate them. As I wrote in Behavioral Defense in Decision Making,there are a number of steps one can take to stay as unbiased as possible. One of my favorites is to consciously seek out the strongest possible opposite point of view that contradicts my thesis. If done well, this can lessen the impact of many biases, such as anchoring, over-confidence, and base-rate neglect.
I frequently get asked by prospective investors about what my ‘edge’ is as an investor. Sometimes I think the answer that they are looking for is some proprietary model, some black box that spits out superior answers that nobody possesses, or an ability to know what the future holds based on some proprietary network of sources. The real answer is less exciting, but nonetheless quite effective. It is the combination of the traits and behaviors that I described above. I would add a sixth one to the list – staying humble while maintaining your confidence. History is littered with many seemingly great investors who fell apart and produced disappointing results for their clients just as they had accumulated the greatest amount of assets after a good run of performance. Perhaps some of them were never as great as they seemed, but in other cases, I can’t help but think that it was a combination of hubris and complacency that led them astray.
The best investors stay humble – always thirsting to learn and improveas well as accepting that they are fallible and can make mistakes. This helps them to be on guard against the traps of complacency and overconfidence. Some view this posture as inconsistent with confidence in one’s abilities – after all, this is an industry where some think that the best investors are supposed to be on CNBC or on the cover of some financial magazine telling the world how great they are, which seems incompatible with a humble, introspective approach. Believe me, the people I admire most as investors have rejected this false dichotomy and are able to balance humility with confidence and competence in a way that allows them to continue to improve for many years.
Company Updates
O-I Glass (OI)
I did an in-depth presentation on OI, which is our largest investment, at the Manual Of Ideas WideMoat Investing Summit in June. I am including the detailed presentation with this letter.
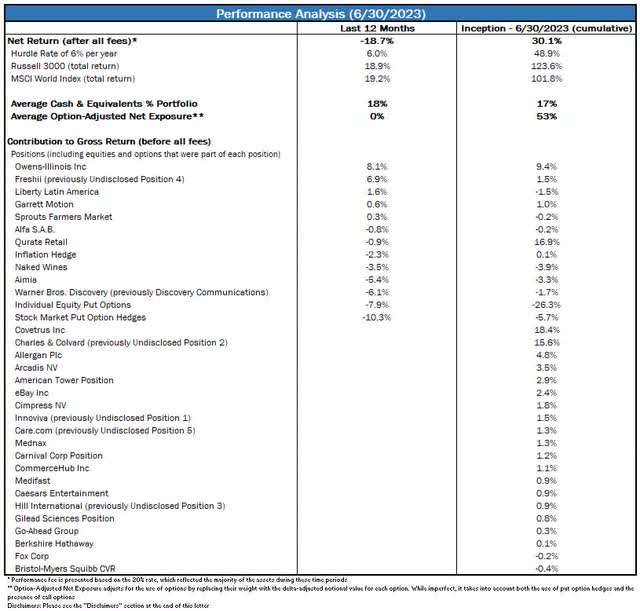
Performance Discussion and Analysis
I encourage you to consider the results summarized below in conjunction with both the investment thesis tracker as well as the discussion of the individual companies in this letter. Any investment approach that is judged over less than a full economic and market cycle is liable to appear better than and worse than it really deserves at different points. Ultimately, it is the quality of the investment process and the discipline with which it is implemented that determines the long-term outcome. Therefore, I strongly encourage you to focus on process over outcome in the short term.
Portfolio Metrics
I track a number of metrics for the portfolio to help me better understand it and manage risk. I track these both at a given point in time, and as a time series to analyze how the portfolio has changed over time to make sure that it is invested in the way that I intend for it to be. Below I share a number of these metrics, what each means, and what it can tell us about the portfolio. As time passes, you should be able to refer to these charts and graphs to help you gain deeper insight into how I am applying my process.
Price % Base Case Value
This metric tracks the portfolio’s weighted average ratio between the market price and my Base Case intrinsic value estimate of each security. This ratio is presented both including cash and equivalents, which are valued at a Price to Value of 100%, and excluding those. All else being equal, the lower these numbers are, the better. Excluding cash and equivalents, a level above 100% would be a red flag, indicating that the portfolio is trading above my estimate of intrinsic value. Levels between 90% and 100% I would characterize as a yellow flag, suggesting that the portfolio is very close to my estimate of value. Levels between 75% and 90% are lukewarm, while levels below 75% are attractive.
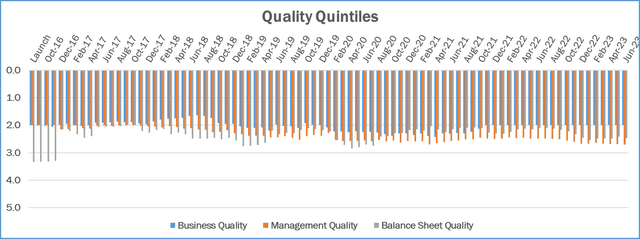
Quality Quintiles
As outlined in the Owner’s Manual, I evaluate the quality of the Business, the Management, and the Balance Sheet as part of my assessment of each company. I grade each on a 5-point scale with 1 meaning Excellent, 2 Above Average, 3 Average, 4 Below Average, and 5 Terrible. The chart that follows presents the weighted average for each of the three metrics for the securities in the portfolio.
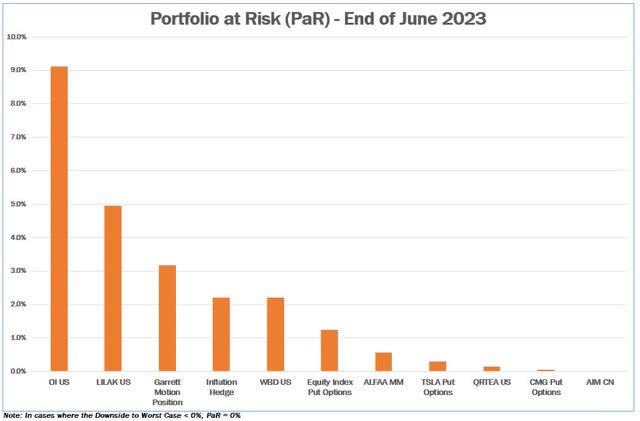
Portfolio at Risk (PaR)
I estimate the Portfolio at Risk (PaR) of each position by multiplying the weight of each position in the portfolio by the percent downside from the current price to the Worst Case estimate of intrinsic value. This helps me manage the risk of permanent capital loss and size positions appropriately so that no single security can cause such a material permanent capital loss that the rest of the portfolio, at reasonable rates of return, would not be able to overcome. I typically size positions at purchase to have PaR levels of 5% or lower, and a PaR value of 10% or more at any time would be a red flag. The chart below depicts the PaR values for the securities in the portfolio as of the end of the quarter. Positions are presented including options when applicable.
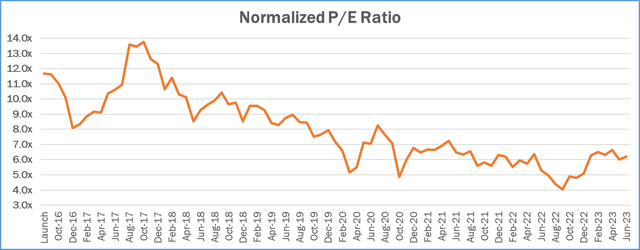
Normalized Price-to-Earnings (P/E) Ratio
I supplement my intrinsic value estimates, which are based on Discounted Cash Flow (DCF) analysis, with a number of other metrics that I use to make sure that my value estimates make sense. One of the more useful ones is the Normalized P/E ratio. The denominator is my estimate of earnings over the next 12 months, adjusted for any one-time/unsustainable factors, and if necessary adjusted for the cyclical nature of the business to reflect a mid-cycle economic environment. The numerator is adjusted for any excess assets (e.g. excess cash) not used to generate my estimate of normalized earnings. One way to interpret this number is that its inverse represents the rate of return we would receive on our purchase price if earnings remained permanently flat. So a normalized P/E of 10x would be consistent with an expectation of a 10% return. While the future is uncertain, it is typically my goal to invest in businesses whose value is increasing over time. If I am correct in my analysis, our return should exceed the inverse of the normalized P/E ratio over a long period of time. The graph below represents the weighted average normalized P/E for the equities in the portfolio.
Conclusion
Reading the recently released 7th Edition of Security Analysis, edited by Seth Klarman, has been a thought-provoking exercise. One passage in Seth’s essay struck a particular chord as being appropriate for the current investing environment:
“Just as market fluctuations can appear to refute accurate analysis, prices may temporarily seem to validate incorrect conclusions. Investors who gain confidence from rising market prices, for example, may make the mistake of gaining additional conviction in their investments at the very moment when they are, in fact, becoming less and less attractive.
Learning to love markdowns is critical for long-term investment success. Key is the ability to retain the perspective that markdowns represent the opportunity to buy an additional stake in a business at an even better price, and that a markdown is a loss only if you sell.”
I am happy to answer any questions that you have. Your feedback is important to me; please let me know how I can improve future letters. I greatly appreciate your trust and support, and I continue to work diligently to invest our capital.
Sincerely,
Gary Mishuris, CFA Managing Partner, Chief Investment Officer
Silver Ring Value Partners Limited Partnership
IMPORTANT DISCLOSURE AND DISCLAIMERS
The information contained herein is confidential and is intended solely for the person to whom it has been delivered. It is not to be reproduced, used, distributed, or disclosed, in whole or in part, to third parties without the prior written consent of Silver Ring Value Partners Limited Partnership (“SRVP”). The information contained herein is provided solely for informational and discussion purposes only and is not, and may not be relied on in any manner as legal, tax, or investment advice or as an offer to sell or a solicitation of an offer to buy an interest in any fund or vehicle managed or advised by SRVP or its affiliates. The information contained herein is not investment advice or a recommendation to buy or sell any specific security.
The views expressed herein are the opinions and projections of SRVP as of June 30th, 2023, and are subject to change based on market and other conditions. SRVP does not represent that any opinion or projection will be realized. The information presented herein, including, but not limited to, SRVP’s investment views, returns or performance, investment strategies, market opportunity, portfolio construction, expectations and positions may involve SRVP’s views, estimates, assumptions, facts and information from other sources that are believed to be accurate and reliable as of the date this information is presented-any of which may change without notice. SRVP has no obligation (express or implied) to update any or all of the information contained herein or to advise you of any changes; nor does SRVP make any express or implied warranties or representations as to the completeness or accuracy or accept responsibility for errors. The information presented is for illustrative purposes only and does not constitute an exhaustive explanation of the investment process, investment strategies, or risk management.
The analyses and conclusions of SRVP contained in this information include certain statements, assumptions, estimates, and projections that reflect various assumptions by SRVP and anticipated results that are inherently subject to significant economic, competitive, and other uncertainties and contingencies and have been included solely for illustrative purposes
As with any investment strategy, there is potential for profit as well as the possibility of loss. SRVP does not guarantee any minimum level of investment performance or the success of any portfolio or investment strategy. All investments involve risk and investment recommendations will not always be profitable. Past performance is no guarantee of future results. Investment returns and principal values of an investment will fluctuate so that an investor’s investment may be worth more or less than its original value.
Original Post
Editor’s Note: The summary bullets for this article were chosen by Seeking Alpha editors.
Read the full article here