


Netflix, Inc. (NASDAQ:NFLX) revenues missed in Q2 2023, price dropped 8%, and that signaled the end of this tremendous bounce up from an oversold bottom. NFLX price will now continue its search for a price that reflects the strategic changes and the lack of growth in revenues. The latest earnings reality check and subsequent price drop simply mean NFLX is overpriced.
Nobody should be surprised at that conclusion. The optimistic bounce up was overdone, just as the selloff to the bottom was overdone. Now price is adjusting to reality. Portfolio managers now know they can buy NFLX cheaper, and they will wait for that price to buy. Meanwhile, the sellers will take price lower. If NFLX continues to underperform the Index, some portfolio managers will switch from buying to selling.
NFLX has a high growth, high P/E, and high PEG premium priced in, but is no longer a high growth stock. Elimination of the basic service, the use of the cheaper ad service, and the crackdown on the use by non-paying password users has increased subscribers, but revenues still missed expectations. Thus, price is dropping to adjust to forecast.
Here is our daily chart that shows demand declining and Supply increasing to take price lower:
Netflix sell signals, price drops looking for support at $400 and $380 (StockCharts.com)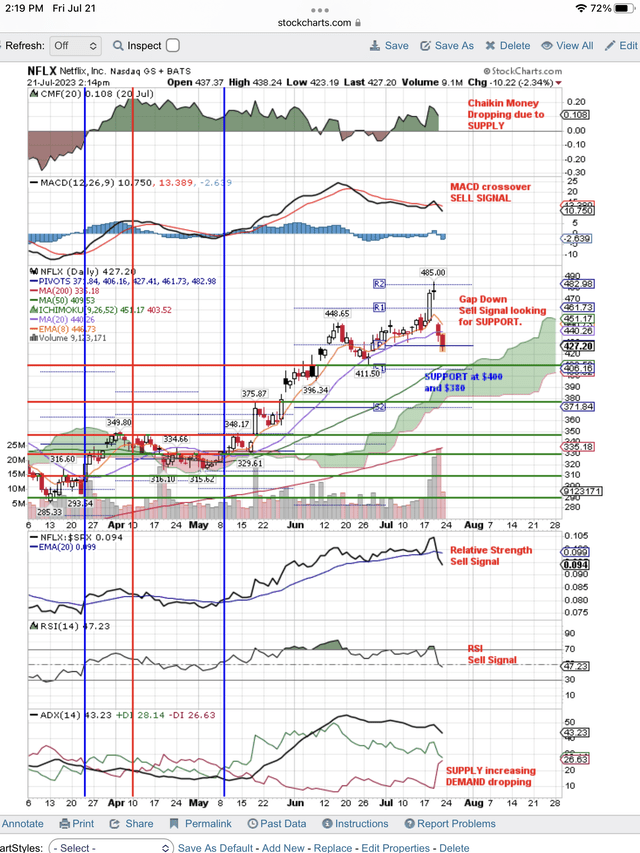
On the above chart you can see all the Sell Signals and Supply taking price down looking for support. We have drawn horizontal, price support lines near $400 and $380. The Relative Strength signal is the one portfolio managers will be watching to buy or sell.
Since we are trying to determine what support level will hold, we want to look at the old Point & Figure chart, which is famous for helping to identify support levels when price is dropping. As traders will remind us, “There are no support levels on a diving stock until it stops falling.” As we can see with NFLX, it is breaking support levels on the way down.
Identifying support levels on the way down (StockCharts.com)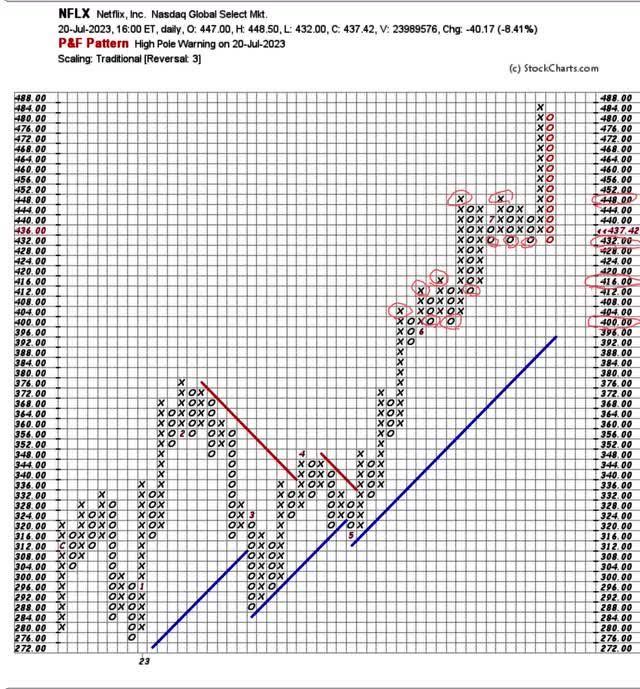
As you can see on the above chart, the falling column of red “Xs” broke through “X” support that we circled at $448. It went down to “O” support yesterday, circled at $432. Today, Friday, July 21, it broke that support level, which is bearish. It means price is going lower, looking for the next support level.
You can see that we have circled the next column “X” support level at $416 and the next “O” support level is very close at $412. If these don’t hold, then it is on to $400 for another test of support.
Those portfolio managers that have decided to “buy on weakness,” as they are always forced to do, will come in at these support levels. They will also do what traders never do, they will average down. Portfolio managers are fundamentalists, and they have already calculated the fair market value where they will come in and buy. We now know that value was not $432. As you can see on the above chart, the worst case scenario is a drop to the “X” column support at $372.
Read the full article here