


This is an update to our series of articles started in 2012 assessing market valuation and estimating forward stock market returns. The most recent previous update was April 2023.
The December 2021 update concluded that the then prevailing condition of overvaluation suggested zero returns from stocks to the end of 2028 and the danger of an imminent major downturn for equities. By end of March 2023 the S&P 500 was 15% lower and since then the index has recovered and is now only 4% down from the December 2021 high.
The projections here are partly based on Estimating Forward 10-Year Stock Market Returns using the Shiller CAPE Ratio and its 35-Year Moving Average, which is referred to as the “referenced article” further down.
What short-term stock market returns can be expected?
Nobody knows, and the best one can do is to use the historic data (which is from Shiller’s S&P series) to guide us to make estimates for the future. From the real price of the S&P-Composite with dividends re-invested (S&P-real) one finds that the best-fit line from 1871 onward is a straight line when plotted to a semi-log scale. There is no reason to believe that this long-term trend of S&P-real will be interrupted.
S&P-real and the best fit line together with its 95% prediction band lines are shown in Figure-1, updated to end of July 2023. (See the appendix for the equations.)
The S&P-real average July level of 4,497 is now 24% above the long-term mean trend level of 3,638, (Figure-2).
iMarketSignals iMarketSignals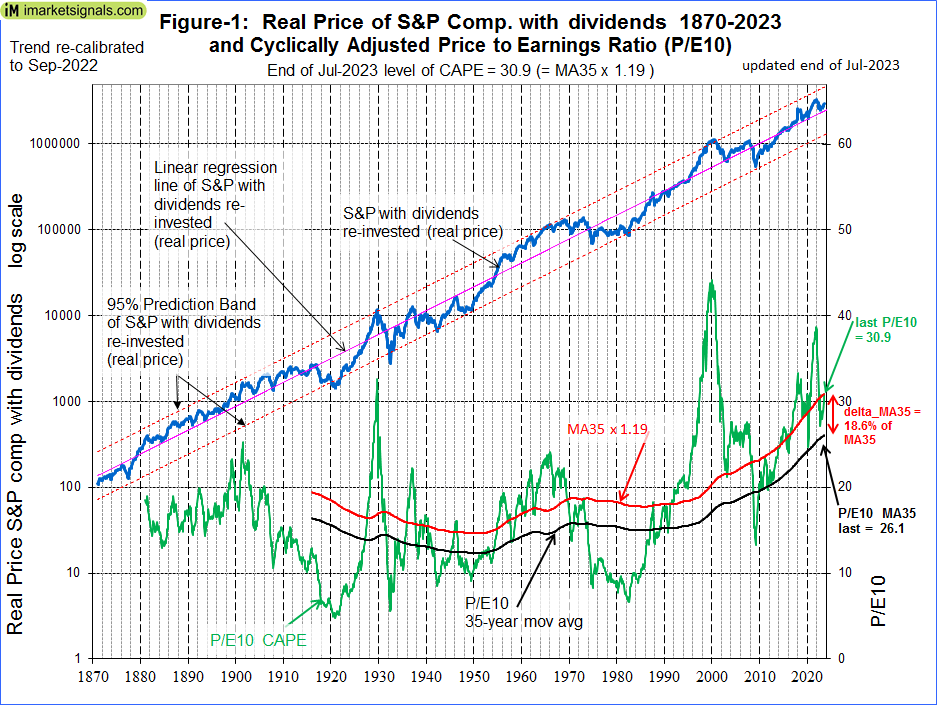
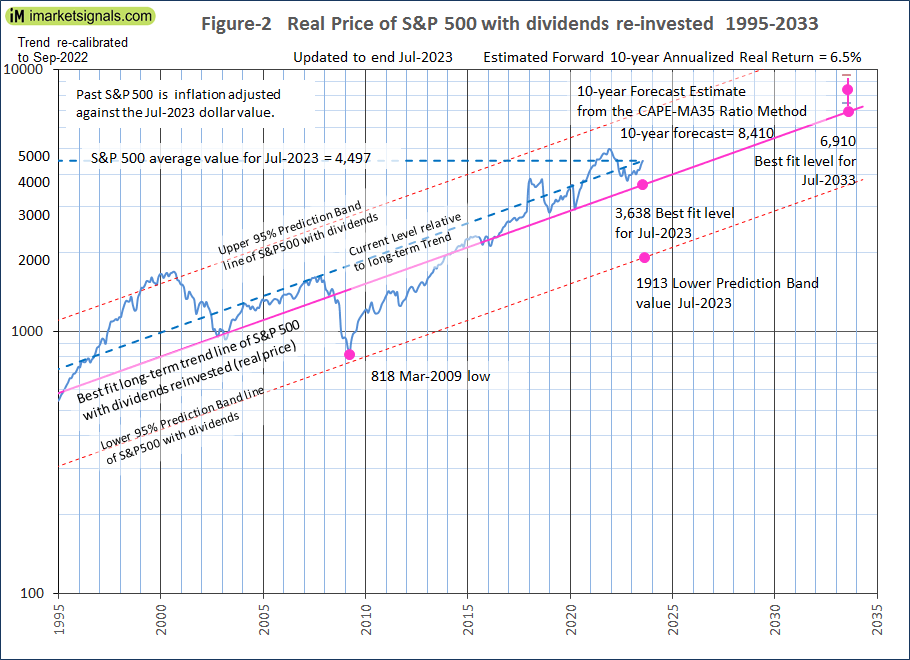
In Figure-2 the current level of the S&P 500 relative to the long-term trend is indicated by the line parallel to the long-term trend line. Note that this relative level is now about the same as it was at mid-2007 prior to the 55% decline of the S&P 500 to the March 2009 low. So it is possible for the S&P 500 to produce a similar decline from the current level.
Forecasting stock market returns with the CAPE-MA35 Ratio
Also shown in Figure-1 are the CAPE-ratio (which is the S&P-real divided by the average of the real earnings over the preceding 10 years) and its 35-year moving average (MA35), having end of July 2023 values of 30.9 and 26.1, respectively. Thus, the CAPE is 19% above its MA35.
As shown in the referenced article, a superior method to the standard use of the Shiller CAPE-ratio is to predict 10-year real returns using the CAPE-MA35 ratio as a valuation measure. It is simply the value of the Shiller CAPE-ratio divided by the corresponding value of its 35-year moving average (30.9 / 26.1 = 1.19).
Currently the CAPE-MA35 ratio of 1.19 forecasts a probable 10-year annualized real return of about 6.5% to end of July 2033. Based on the current S&P 500 value this would indicate an end of July 2033 value of 8,410 for S&P-real, with upper and lower confidence values of 9,500 and 7,400, respectively (Figures-2 & 3).
iMarketSignals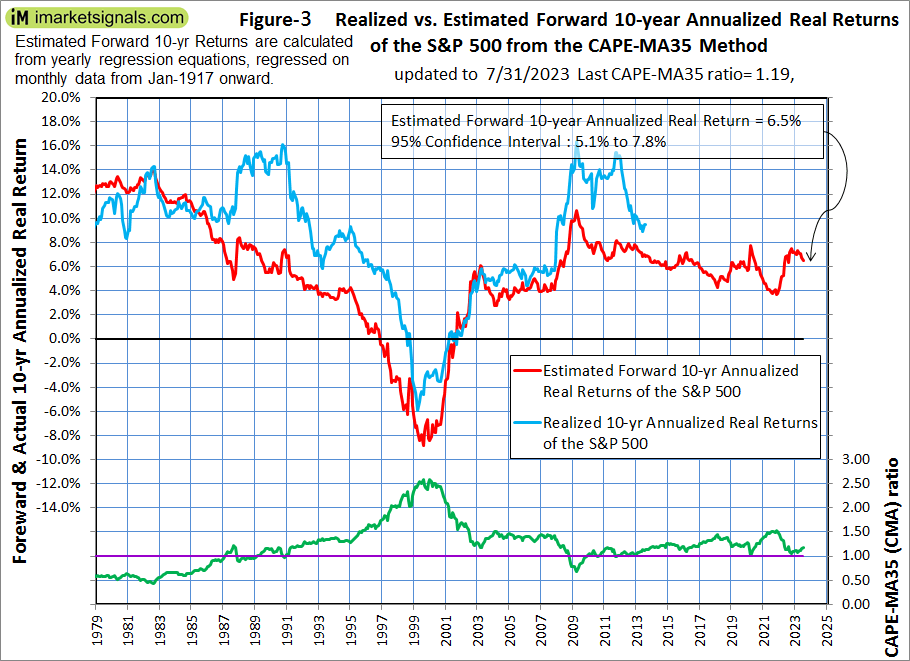
Figure-4 shows the historic forward 10-year annualized real returns for CAPE-MA35 Ratios ranging from 0.3 to 2.6. For the current CAPE-MA35 Ratio of 1.19 the returns ranged from -4% to 14%. One observes that once the CAPE-MA35 Ratio becomes less than 1.0 the historic forward returns were all positive.
iMarketSignals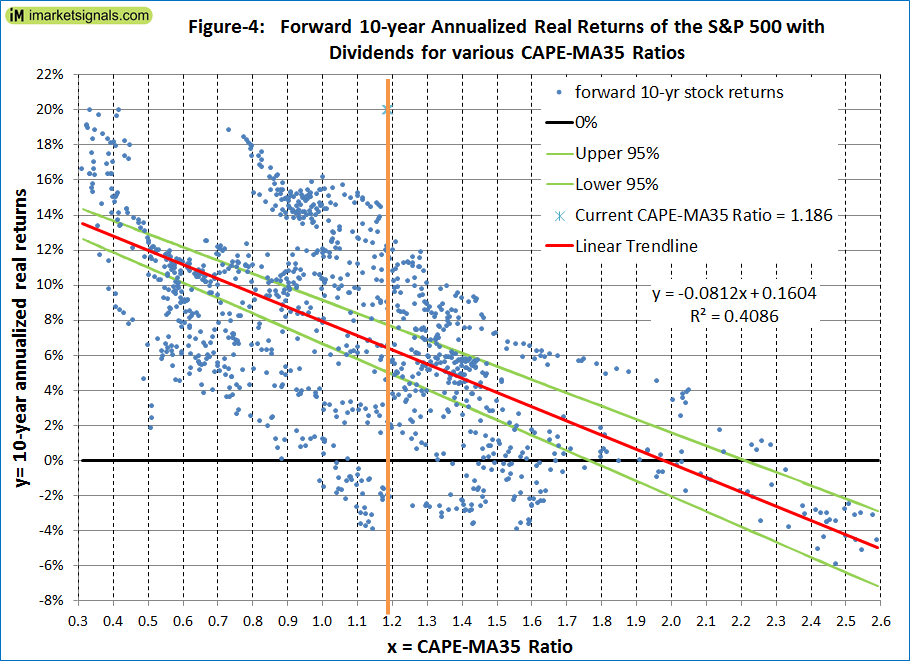
Forecasting returns to 2033 with the long-term trend
When extending the best fit line and the prediction bands (Figure-2), then the S&P-real end of July 2033 value would be 6,910.
Thus, the historic trend forecasts a probable total gain of about 54% (or an annualized return of 4.4%) for S&P-real from its end of July 2023 level of 4,497 to the end of July 2033 best fit level of 6,910.
Conclusion
- The current level of the S&P 500 relative to the current long-term trend level indicates that stocks are moderately overvalued; and
- The current CAPE-MA35 ratio of 1.19 forecasts a 6.5% real 10-year forward return for the S&P 500, while the long-term trend indicates a forward return of 4.4%; and
- The current condition does not exclude the possibility of a major downturn for equities, but the expected 10-year forward returns look reasonably good.
Appendix
The best fit line and prediction band (re-calibrated to Sep-2022)
The best fit line and prediction band were calculated from monthly data from Jan-1871 to Sep-2022. This includes now an additional 10 years of data of the SP-real values for the period after July-2012, previously not included in the regression analysis.
The equation of the best fit line is y = 10(ax+b)
Where y = is the dependent variable of the best fit line, x = are the number of months from January 1871 onward, a =0.002321819 and b = 2.133179076
The parameters for the 95% prediction band lines are:
Upper: a = 0.002321819, b = 2.412217299 and Lower: a = 0.002321819, b = 1.854140854.
Read the full article here