


Bears Control Short-Term Trend
The S&P 500 established a new uptrend following the October 2022 low by making a series of higher highs and higher lows. The anchored volume weighted average price (AVWAP) chart below shows buyers remain in control of the longer-term trend. A sustained break of the region near 4090 would have to occur to put the current rally in doubt. Other areas of relevant support come in near 4320 and between 4240 and 4090. As long as the S&P 500 remains above these levels, weakness will continue to be classified as a normal retracement in the context of an established uptrend, which means the longer-term odds are still favorable for the SPDR S&P 500 ETF (NYSEARCA:SPY).
CCM / Stockcharts.com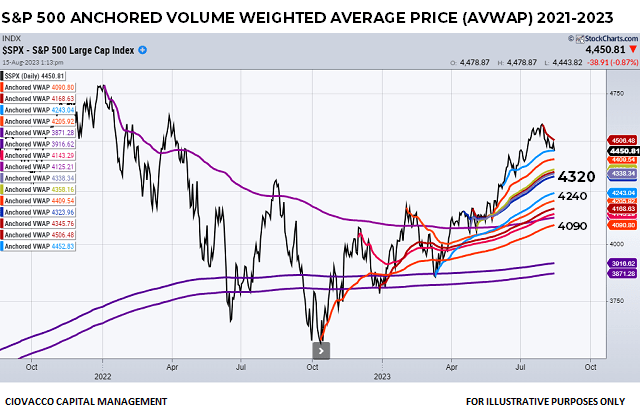
The Market’s Take On Longer-Term Risk
While the combination of fundamental factors varies significantly over time, an uptrend is an uptrend and a downtrend is a downtrend. To illustrate the concept, let’s examine the transition from a bull market to a bear market and then back to a bull market in the 1998-2004 and 2006-2009 periods.
The 1998-2004 monthly S&P 500 chart below has a moving average envelope, which provides insight into the strength of the market’s trend. Trends and the stock market’s risk/reward profile tend to be more favorable when price is above a rising moving average envelope, which was the case in the late 1990s. The trend began to roll over in late 2000 as economic concerns increased. Calendar year 2001 featured a clear downtrend with price remaining below a downward sloping moving average envelope. As market participants became more confident in the economy, the trend flipped back to the bullish side of the ledger in 2003.
CCM / StockCharts.com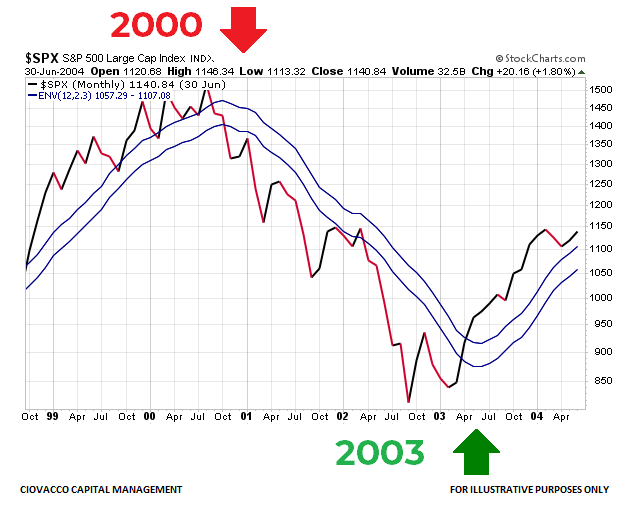
2006-2009: Different Problems – Similar Transition
While the primary fundamental issues were significantly different in the financial crisis window (2006-2009), the transition from economic confidence to economic fear and back to economic confidence was very similar to the 1998-2004 window.
CCM / Stockcharts.com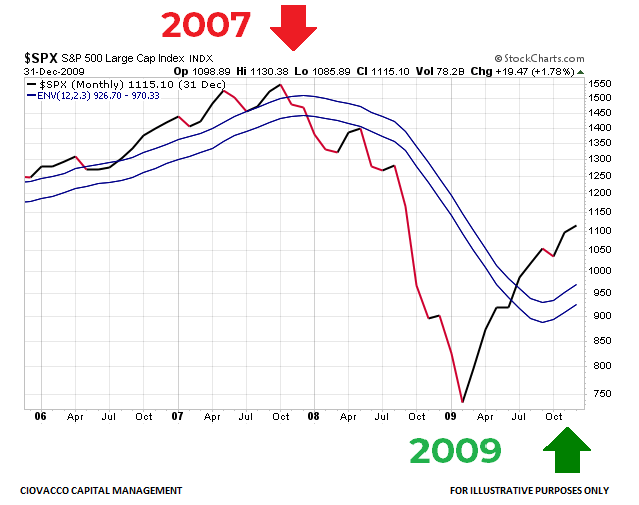
How Does The Same Chart Look Today?
The chart below is more helpful if we are willing to review it in an unbiased and objective manner. The market’s long-term profile in 2023 looks similar to the favorable setups in 2003 and 2009 (after major stock market lows). The S&P 500 moved back above the moving average envelope in March 2023 and the slope of the envelope flipped from down to up in April, which speaks to increasing longer-term economic confidence.
CCM / Stockcharts.com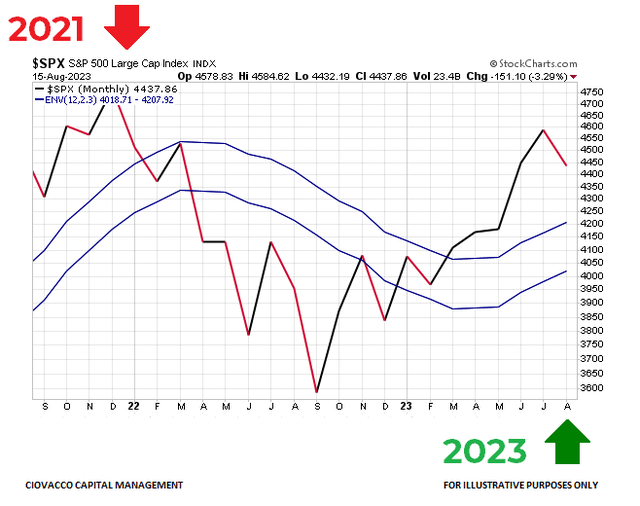
Secular Trends and Demographics
A July article provided evidence supporting the resumption of the S&P 500’s long-term bullish trend. If we place the same moving average envelope on the chart of the S&P 500 during the secular bull market in the 1980s and 1990s, the look of the bullish turn in the 1988-1989 window below is similar to the 2022-2023 turn shown above.
CCM / Stockcharts.com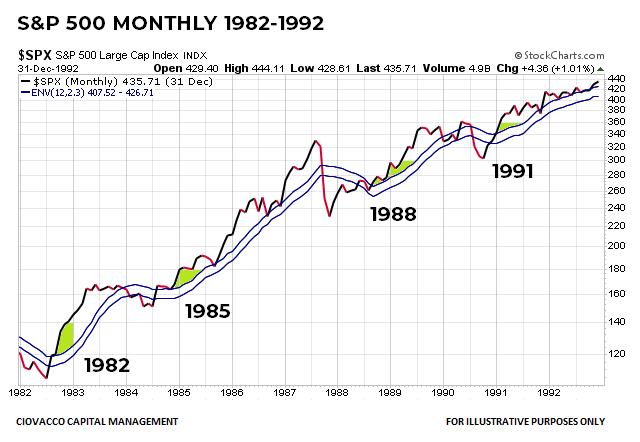
The 1988-89 and 2022-23 windows also have another important similarity, a large demographic group in an economically-productive window. As outlined in a recent review of demographic trends, the median age of baby boomers was 36 between 1988 and 1994; millennials will have a median age of 36 between 2022 and 2027.
Base Case: Countertrend Move Within Bullish Trend
While we will continue to take it day by day with an open mind about a wide range of outcomes, the weight of the evidence says the current weakness in stocks is a healthy countertrend move within a longer-term bullish trend. The monthly chart below, which uses different moving average envelope settings, helps illustrate these concepts. The lime green arrow shows the resumption of the secular bull market in 1991; the orange and red arrow shows the early stages of the 2000-2002 bear market.
CCM / Stockcharts.com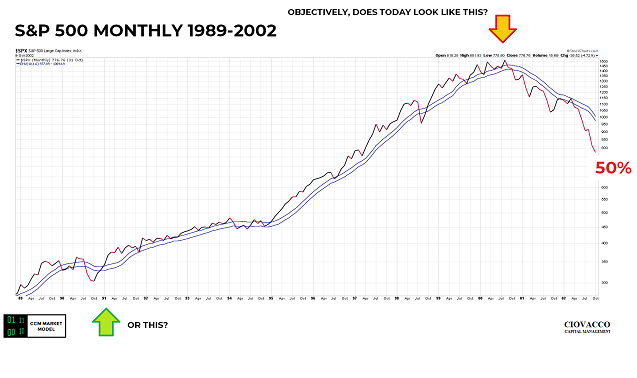
Does the August 15, 2023 chart below look more like the resumption of the bullish trend in 1991 or more like the bearish rollover in 2000 that was associated with a 50% drawdown in the S&P 500?
CCM / Stockcharts.com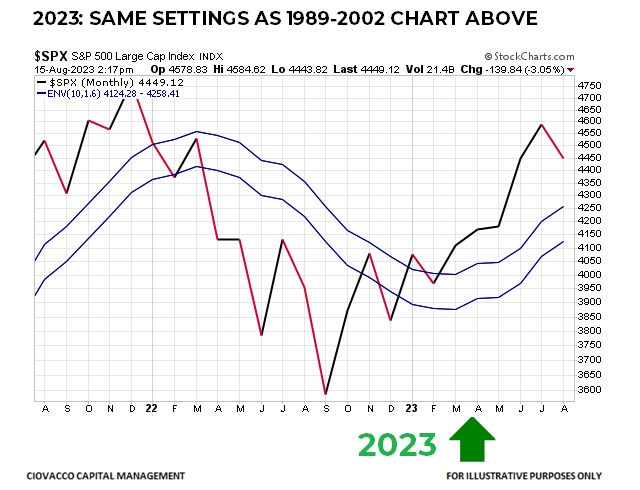
History says the odds favor the S&P 500 making a higher high following the bout of weakness, which means the outlook for SPY and numerous other highly-correlated stock ETFs, including the Invesco NASDAQ 100 ETF (QQQ), continues to be constructive.
Personal Opinions Mean Little
The expression the market doesn’t care what you think speaks to the fact that markets set asset prices. If we want to increase our odds of success, it is logical to listen to the market, rather than concern ourselves with what might be, could be, or should be.
Read the full article here