

Market Commentary
After back-to-back quarters of positive returns, the Bloomberg US Aggregate Bond Index slipped back into the red, losing -0.84% in Q2. Despite the drop, the index remains well ahead of 2022’s year-to-date performance over the comparable period, +2.09% compared to a loss of -10.35%. Exhibit 1 is an illustration of the index’s performance since the turn of the century for comparison purposes.
Exhibit 1 – Bloomberg US Aggregate Bond Index, Year to Date (%)
Source: Bloomberg.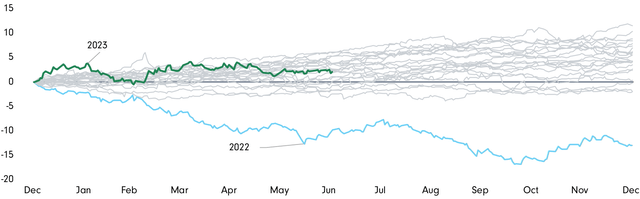
Fading of the Regional Bank Crisis
We’re quite a bit removed from the final days of Q1, when failing regional banks were dominating the headlines on a regular basis. But let us not forget that Q2 began while concerns were still swirling around the viability of First Republic and other regional banks. In fact, the First Republic issue wasn’t resolved until early May, when JPMorgan acquired most of its assets.
By the end of the quarter, the financial markets had stabilized, and we learned that all 23 of the US banks that were subjected to the Federal Reserve’s annual stress test weathered the severe recession scenario while continuing to lend to consumers and corporations. The banks were able to maintain minimum capital levels, despite $541 billion in projected losses for the group, while continuing to provide credit to the economy in the hypothetical recession. This year’s simulation included unemployment surging to 10%, a 40% decline in commercial real estate values and a 38% drop in housing prices. It should be noted that the stress testing is focused on the largest banks and super regionals and does not include smaller banks, which were the cause of the angst in Q1, so the “all clear” that the test usually delivers was less than reassuring.
Federal Reserve Battles On
The labor market continued to prove resilient, with an additional 253,000, 339,000 and 209,000 jobs added in April, May and June, respectively, pushing the average monthly job gain since the beginning of 2023 to 310,000 and over the past 12 months to 335,000.
With the strength in the labor market, the Federal Reserve continues to focus its efforts on inflation. The Fed hiked 25 basis points (bps) in May before hitting the pause button in June. But June’s meeting was a combination of dovishness (rate pause) and hawkishness (Statement of Economic Projections or SEP illustrated an additional two rate hikes by year-end, an increase from the previous SEP), leaving the door open to more uncertainty in the coming months.
As of June 30, the market was on board with a rate hike in July, pricing in an 81% chance of a 25-bps hike at the July 26 meeting, compared to expectations for a cut at that meeting at the beginning of the quarter. With June’s CPI report showing that inflation is slowing down, having climbed only 3% from a year earlier, we may see the market and the Fed meet in the middle with one rate hike in July and then a prolonged pause as we head into the end of the year. The 3% increase over the past 12 months marks the slowest pace of increases in more than two years and harkens back to the pre-transitory period.
Exhibit 2 — Ongoing Inflation Battle Succeeding (%)
Source: Bureau of Labor Statistics.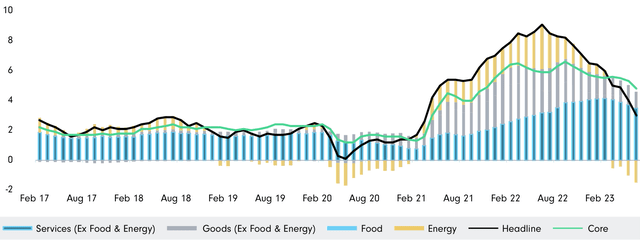
Deal Ceiling Resolution, Kicking the Can Down the Road Once More
The frighteningly traditional game of financial chicken between political parties came to a head at the end of the May as President Biden and House Speaker Kevin McCarthy reached an eleventh-hour agreement to suspend the debt ceiling through the end of 2024.
At the beginning of the month, when negotiations appeared to be going nowhere, yields on T-bills maturing around the expected X-date (early June) were trading with a 7-handle, illustrating the extra compensation demanded by investors to hold the bills most likely to be the cause of default.
The deal was passed by the House and the Senate in the first days of June, which Biden signed into law, once more avoiding the financial catastrophe that would be brought on by a US government default. The rating agencies remained on the sidelines for the most part, though Fitch announced that the US will remain on “negative watch” despite the debt ceiling agreement. Once more, the US has succeeded in kicking the can down the road, with the next showdown coming in 2025.
Portfolio Performance & Positioning
It is important to note our portfolio works to provide yield for investors while focusing on the shorter end of fixed income markets. We believe there are opportunities to add incremental yield over the benchmark by investing in structured products across the quality spectrum. The portfolio strives to maintain an average credit quality rating of A/BBB while taking advantage of mispriced opportunities in unrated securities and an allocation to below investment grade securities.
As of June 30, the portfolio had a yield-to-worst (YTW) of 11.00% with an effective duration of 1.14 years, compared to a YTW of 8.84% and effective duration of 1.11 years at the end of Q1.
The securitized market delivered the strongest performance among the sectors held in the strategy, with unsecured consumer asset-backed securities (ABS) and non-agency commercial mortgage-backed securities (CMBS) leading the way. Within the non-agency CMBS sector, hospitality (focused on trophy properties) and multifamily were the strongest performers; and in the ABS allocation, auto loan, small business and the aforementioned consumer unsecured were the stalwarts. While the strategy is underweight corporate debt, security selection within the sector helped mitigate that position. Our significant underweight to Treasuries contributed positively to performance during the quarter, buoyed by the shorter relative duration.
We continue to search for opportunities in the marketplace while maintaining an attractive yield relative to the benchmark.
|
Period and Annualized Total Returns (%) |
Since Inception (5 Jul 2016) |
5Y |
3Y |
1Y |
YTD |
2Q23 |
Expense Ratio (%) |
|
Class I (MUTF:DHEIX) |
2.69 |
2.36 |
2.70 |
2.83 |
2.91 |
0.93 |
0.52 |
|
Bloomberg US 1-3 Yr. Gov./Credit Index |
0.88 |
1.13 |
-0.88 |
0.52 |
1.13 |
-0.37 |
— |
|
Must be preceded or accompanied by a Prospectus. The 30-day Yield represents net investment income earned by the fund over the previous 30-day period, expressed as an annual percentage rate based on the Fund’s share price at the end of the 30-day period. The 30-day SEC Yield for the Short Duration Securitized Bond Fund (Cl I) is 6.63%. Risk disclosure: In general, when interest rates rise, fixed income values fall. Lower quality/high yield securities involve greater default risk or price changes than bonds with higher credit ratings. Mortgage- and asset-backed securities are influenced by factors affecting the housing market and the assets underlying such securities. The securities may decline in value, face valuation difficulties and become more volatile and/or illiquid. They are also subject to prepayment risk, which occurs when mortgage holders refinance or repay loans sooner than expected, creating an early return of principal to loan holders. The views expressed are those of Diamond Hill as of 30 June 2023 and are subject to change without notice. These opinions are not intended to be a forecast of future events, a guarantee of future results or investment advice. Investing involves risk, including the possible loss of principal. Past performance is not indicative of future results. Investment returns and principal values will fluctuate so that an investor’s shares, when redeemed, may be worth more or less than their original cost. The Fund’s current performance may be lower or higher than the performance quoted. For current to most recent month end performance, visit Diamond Hill. Performance assumes reinvestment of all distributions. Returns for periods less than one year are not annualized. Fund holdings subject to change without notice. Index data source: Bloomberg Index Services Limited. See Diamond Hill – Disclosures for a full copy of the disclaimer. Analytics provided by The Yield Book® Software. Carefully consider the Fund’s investment objectives, risks, and expenses. This and other important information are contained in the Fund’s prospectus and summary prospectus, which are available at Diamond Hill or calling 888.226.5595. Read carefully before investing. The Diamond Hill Funds are distributed by Foreside Financial Services, LLC (Member FINRA). Diamond Hill Capital Management, Inc., a registered investment adviser, serves as Investment Adviser to the Diamond Hill Funds and is paid a fee for its services. Not FDIC insured | No bank guarantee | May lose value |
Original Post
Editor’s Note: The summary bullets for this article were chosen by Seeking Alpha editors.
Read the full article here