


There have been many cross currents at play in 2023, which has made this year a tough year for investors. For example, we’ve seen one of the most inverted yield curves in modern market history, decelerating domestic liquidity, the threat of a looming recession, all coupled with a string of large failing banks. This has led to some of the most bearish bets in the markets since 2011, as most investors have piled into cash, treasuries and shorts.
Bloomberg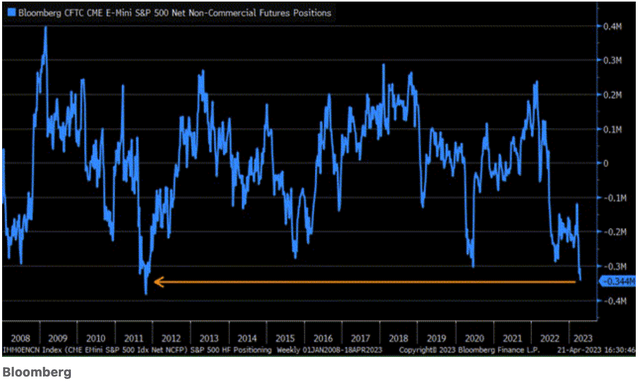
As the old saying goes, “the market tends to move in the direction that hurts the most people.” In Q2 of 2023, that direction was up. Today, based on macro data coupled with an outsized cash position in equities, the direction is still likely up from here, short of an unforeseen event triggering a July top.
It is our belief that a recession is unavoidable. The 2022 bear market did not price in this recession, leaving the only question as to when this recession will hit? Based on historical data from when the yield curve inverts at various durations and the average lag time between those inversions, the most likely range will be Q4 of 2023, at the earliest – Q1 of 2024, at the latest.
Many investors are now calling for a soft-landing based on the new 2023 bull market. We believe this is a cyclical bull within a secular bear market, and have outlined three potential scenarios this bull market could take based on when a recession is likely to hit.
Strong Growth = Strong Inflation
This was a theme we introduced in our June report. We believe this theme is still valid, and that the ongoing disinflation that equities have been celebrating will likely not last. Though we believe inflation will likely hit equities in the next 3 months, it’s important to understand that this is not happening now.
The chart below supports this, as the job market continues to accelerate, along with heavy truck sales, home prices, retail sales, and a stable consumer. According to the economic trends we are seeing, there is simply no evidence of a recession brewing in Q3 of this year, and this is important for investors to realize this when looking for some type of top.
Tech Insider Network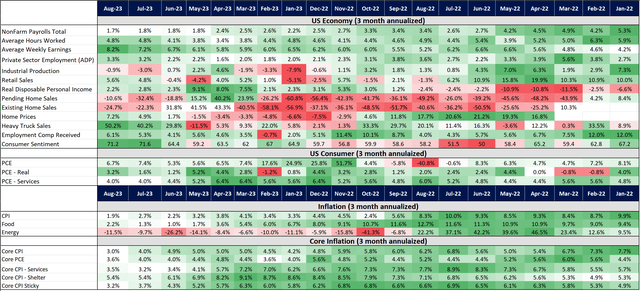
However, what the market may not be pricing in, and could cause a roadblock in the near future, is the theme we continue to repeat – with stubborn growth will come stubborn inflation.
This is an important theme because equities are rallying under the assumption that the Fed has dealt with inflation, and can therefore pause and even lower rates sooner than most think. So, if inflation starts surprising to the upside again, this will throw a wrench into this assumption, and force equities to reprice a new Fed timeline.
The inflation data in the same chart above breaks down the disinflation the market is celebrating in the headline CPI numbers. The question is – will this trend continue, and further support the bull market? What becomes clear when you look at the pattern is: 1) Core inflation remains sticky, and still notably above the Fed’s target 2% target; 2) the reason for the CPI data’s deceleration is because of energy prices. We just saw crude oil go through a +1.5 year bear market that appears to be stabilizing. I do not believe energy commodities will be able to support further CPI readings into the future.
Crude Oil
Crude is not only working on its first higher high in over a 1.5 year time frame, but it is also working on a developing 5-wave pattern off the low. If this bounce can hold the $76.30 support and then turn towards $89, then the next few months could put pressure on equities as oil continues higher.
Tech Insider Network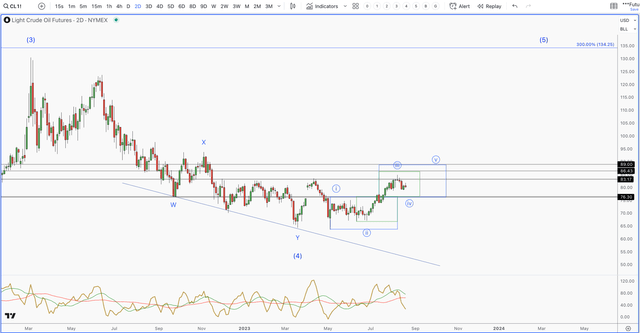
Gasoline
Gas prices are one of the most significant elements within an inflationary environment. The reason is because it is so closely followed by all consumers. You can’t drive more than a few miles without seeing gas prices advertised on the road. Because of this, they have a strong psychological effect on the consumer’s behavior.
The below chart is not encouraging. We have an incomplete 5-wave pattern in play, which suggests one more push to new highs before completing. Furthermore, note the inverse head and shoulders pattern developing below the $2.8-$3 pivot. If price breaks above the $3 pivot, we should see a sharp rise that will only put pressure on future CPI readings, as well as equities.
Tech Insider Network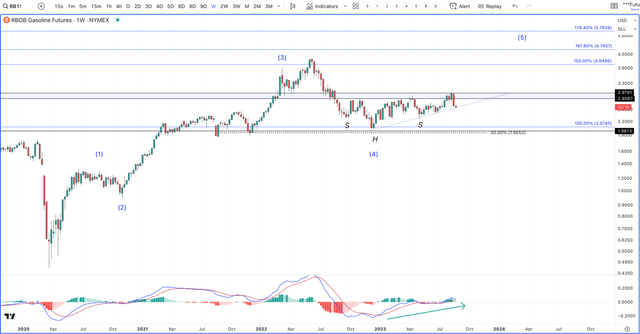
So, with energy not able to do the lion’s share of the deceleration within the CPI data, this leaves core inflation to pick up the slack. As shown, in prior reports, we’ve never seen an instance going back to the 1940s where core inflation got out of control and went down without the help of a recession. So, in order for this to be the case, it will literally be the first instance in modern market history.
Furthermore, with the consumer sentiment hitting a 20 month high, real disposable income staying positive for over a year, and employment compensation accelerating to a 9 month high, it is unlikely that the consumer will slow spending on discretionary items.
So, the problem, as it relates to equities is core inflation, not headline numbers. As long as core inflation remains notably above the Fed’s target, they will not be able to lower rates, and start a new round of QE. These tools are the primary mechanism for flooding the economy and markets with liquidity. The reason this matter is because liquidity is what is needed to confirm a prolonged bull market, and the Fed continues to drain it from the economy with no end in sight.
Tech Insider Network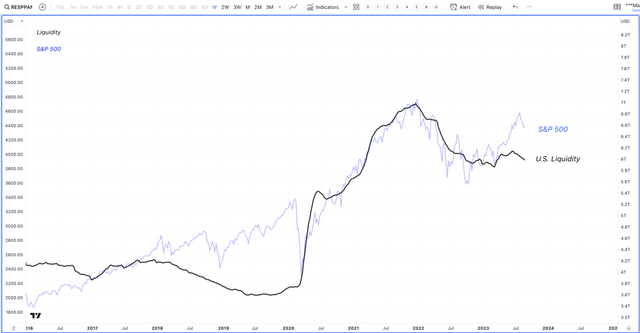
Potential Paths the Broad Market Could Take
With the macro dynamics in place, the odds that a soft-landing, or a mild recession that was priced in with the 2022 decline is quite low. Inflation is likely not fixed, and the Fed has no choice but to remain restrictive. However, this does not mean that the market cannot continue to push higher based on when the recession is likely going to hit.
For this reason, I have outlined 3 potential scenarios the S&P 500 (SPX) could take based on when a recession will likely hit.
- Blue – This count assumes that we already topped, and in the early stages of a large drop to new lows. We would need to see SPX make two consecutive new lows towards the $4275 region for confirmation.
Based on the catalyst being likely recession, there is simply no evidence of a Q3 recession. So, in order to be confirmed, it would have to be price action picking up on some type of unknown event/black swan. These black swan events have a higher likelihood of happening in an elevated rate environment, but it is simply not an investible strategy. If this is playing out, it will show up in price action first, which we will discuss below.
- Green – This count assumes a Q4 recession. It would mark this drop in equities as a correction within a larger uptrend. However, once we push to new highs, it should be the final swing in this cyclical bull market. I would look for some type of top in mid-October – early November. For confirmation, we need to see SPX break above 4425 soon.
- Red – This count assumes a Q1 recession. We would likely trade sideways after making one more high into October/November, followed by a large swing to new highs into the February/March timeframe of 2024. The same confirmation as the green count would apply, and we would not know if this is in play or the green count until we see new highs followed by the next drop.
Tech Insider Network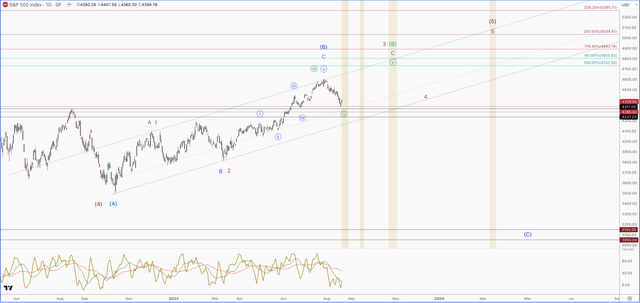
What will determine if this is a buying opportunity (green or red) vs. a major top (blue), will be the structure of this drop. The Blue count suggests that we are starting the final leg in a large degree correction.
These final legs (C waves) are always in the form of a 5-wave pattern. While the green and red counts suggest a correction in a larger uptrend. Corrective patterns are always 3-wave patterns. So, the question is 5-waves down or 3-waves?
If we zoom into the S&P 500, so far, we only have 3-waves down (green). Now, this can morph into a 5-wave pattern. But, it would require two more lower lows and one more failed bounce. If this happens, no bounce can break above 4425. If we get a break above 4425, then odds start favoring the green or blue count, and we will start looking to buy any following dips.
Tech Insider Network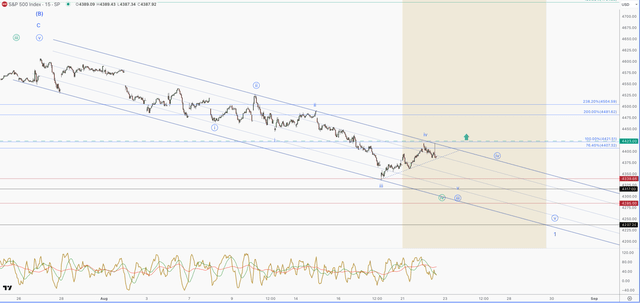
In conclusion, the NASDAQ has provided the best 6 month performance in its history. The prior year we saw such epic returns was in 2019. Interestingly, this was a similar year where many cross currents confounded investors. We saw similar short covering as investors attempted to front run a recession due to decelerating growth. We do not believe a recession is priced into equities, and that it is inevitable. However, this doesn’t mean that we can’t see higher levels from here, before a recession hits.
Read the full article here