


Recent Market Performance
The SPY(NYSEARCA:NYSEARCA:SPY) and QQQ(NASDAQ:NASDAQ:QQQ) index have fallen 6.7% and 5.8%, respectively since mid-July, with brief rebounds followed by further declines, causing pain for investors.
Seeking Alpha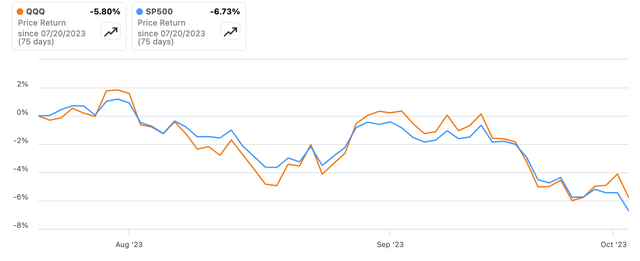
TED spread reverse
Meanwhile, key recession indicators like the TED spread and 10-year/2-year Treasury yield curve have quickly snapped back from June lows into positive territory. The TED spread turned negative before the dot-com crash and 2008 financial crisis – is the rapid reversion now flashing concerning signals?
10-2 year treasury spread (FED)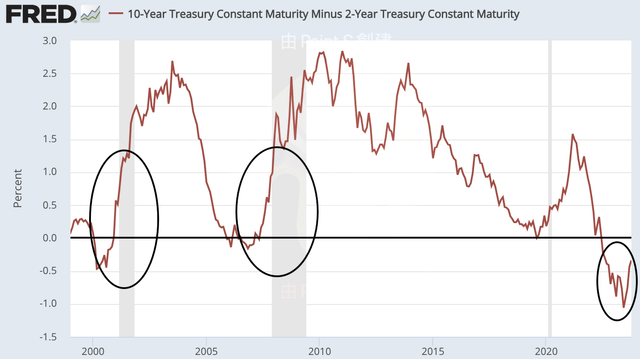
Comparing Past Crisis and Present
However, the current situation differs notably from 2000 and 2008. In those recessions, the TED spread turned positive due to declining Treasury yields, with short-term rates falling faster than long-term. This resulted in a flattening and inversion of the curve.
Today, both short-term and long-term rates are rising, with the 10-year yield rising faster than the 2-year. The curve is positively sloped. Rather than recessionary flattening or inversion, the yield curve is undergoing a steepening – the opposite shape.
10-year and 2 year treasury yield (FED)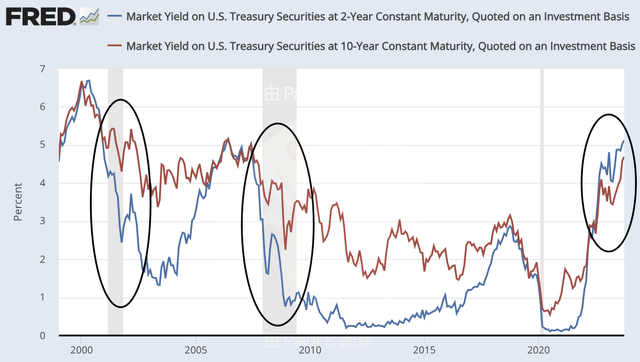
Understanding Treasury Yields
It’s important to understand the factors driving short-term and long-term Treasury yields. The 2-year yield closely reflects Federal Reserve policy rates, rising as the Fed hikes rates. In past recessions, the Fed cut rates amid economic weakness, driving the 2-year yield lower.
Meanwhile, 10-year yields are more influenced by the credit profile of the US government and growth/inflation expectations.
Currently, the Fed is aggressively hiking to combat inflation, pushing the 2-year yield higher. But long-term yields are rising even faster as the government credit profile deteriorates.
Recognizing the distinct yield curve drivers provides critical context. The curve shape reflects the Fed’s inflation fight and government budget concerns rather than the imminent recession.
In other words, it’s the government that can’t maintain its growth, not the corporations.
Government’s Fiscal Challenges
According to the Congressional Budget Office, the US budget deficit is projected to rise from 5.3% of GDP in 2023 to 6.9% by 2033. The major driver is interest expense on debt, which will balloon as rates increase even if the Fed funds rate declines after 2024.
In CBO’s projections, the deficit amounts to 5.3 percent of GDP in 2023. Deficits fluctuate over the next four years, averaging 5.8 percent of GDP. Starting in 2028, they grow steadily; the projected shortfall in 2033 is 6.9 percent of GDP—significantly larger than the 3.6 percent of GDP that deficits have averaged over the past 50 years.
In CBO’s projections, net interest outlays increase by 1.2 percent of GDP from 2023 to 2033 and are a major contributor to the growth of total deficits.
CBO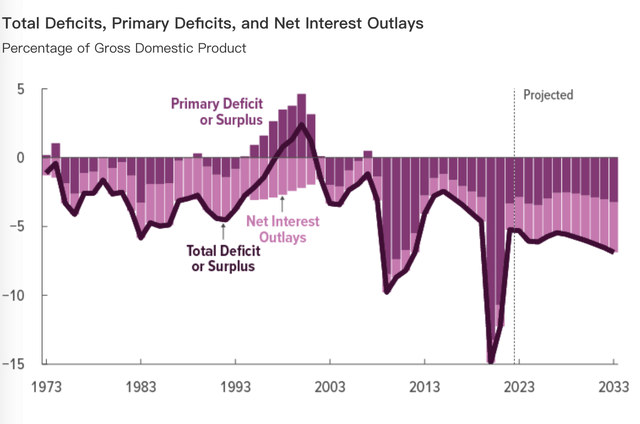
In CBO’s projections, the Federal Reserve further increases the target range for the federal funds rate in early 2023 to reduce inflationary pressures in the economy. That rate is projected to fall in 2024 as inflation slows and unemployment rises. The interest rate on 10-year Treasury notes, however, remains at 3.8 percent from 2024 to the end of the projection period.
CBO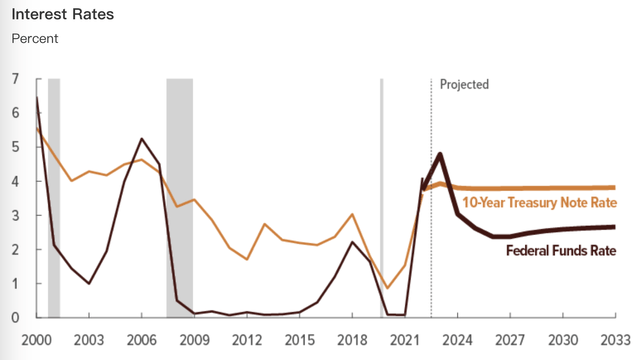
Threats of credit downgrades like Moody’s recent warning on a potential government shutdown will only exacerbate upward yield pressure. Higher Treasury yields raise the “risk-free rate” used in valuation models, which can place pressure on equity valuation.
Below is the quote from the media.
“While government debt service payments would not be impacted and a short-lived shutdown would be unlikely to disrupt the economy, it would underscore the weakness of US institutional and governance strength relative to other AAA-rated sovereigns that we have highlighted in recent years,” Moody’s wrote.
In particular, it would demonstrate the significant constraints that intensifying political polarization put on fiscal policymaking at a time of declining fiscal strength, driven by widening fiscal deficits and deteriorating debt affordability.
So the poor fiscal policy forcing yields higher has a ripple effect across markets. Even if recession is avoided in the near term, the budget outlook and rising debt costs will weigh on the US private sector. This creates an enduring headwind for both bond and stock prices as the “risk-free” rate marches upwards.
A fun fact to note is that the government predicts relatively weak stock market performance in 2023 as they are forecasting lower taxes collected on capital gains in 2023 because of outsize revenues from capital gains in previous years. It seems like the U.S. government is acting like a weak link or a hindrance to private companies.
After reaching a historic high in 2022, receipts from individual income taxes are projected to fall in 2023 because collections from taxes on capital gains realizations and other sources, which have been strong in recent years, fall in CBO’s projections according to the Congressional Budget Office (CBO).
CBO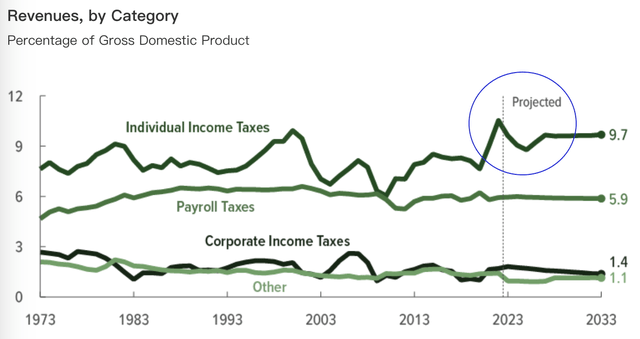
Government Bond vs Private Sector Equity
Once we understand whose issue it is, we can then consider the government’s impact on the private sector. If we look at the correlation of QQQ and SPY with bond ETFs, we can conclude that there is little correlation between these indexes. QQQ and SPY correlation with IEF bond ETF are 0.15 and -0.03 respectively.
5-year correlation (LEL, Yahoo finance)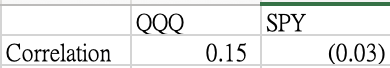
Yahoo finance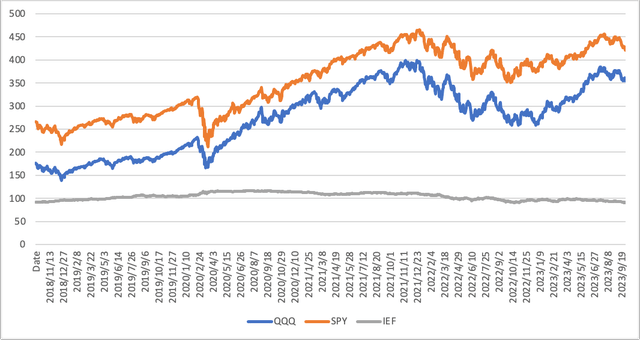
This also aligns with our understanding of investment portfolios, explaining why bonds and stocks make a good risk-diversified combination.
Bond Market Volatility: The MOVE Index
In addition, one indicator worth watching is the MOVE index, which is the index to measures the volatility of the bond as defined below:
The MOVE index is a market-implied measure of bond market volatility. The MOVE index calculates the implied volatility of U.S. Treasury options using a weighted average of option prices on Treasury futures across multiple maturities (2, 5, 10, and 30 years).
The below chart shows that bond prices fell while the MOVE index rose. In 2022 and 2023, the MOVE index increased past the historical average.
Yahoo Finance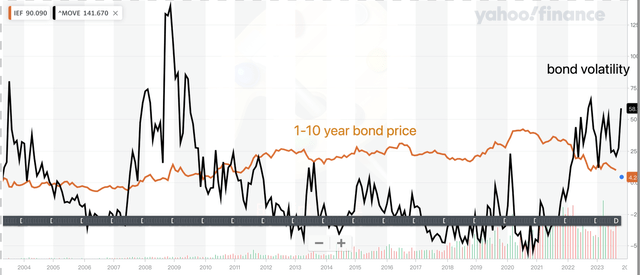
However, when comparing the MOVE index and VIX (a stock market volatility indicator), VIX indicates that stock market volatility is still at a low level.
This strengthens our argument that the present stock market drop is most likely the result of a cascade caused by insufficient government enforcement. This trend suggests that the recent stock market decline is probably the result of repricing brought on by a high weighted average cost of capital (OTC:WACC). It doesn’t always portend a terrible future development or “black swan.”
Yahoo Finance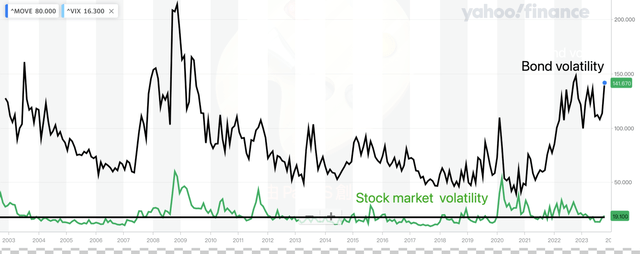
US Service and Manufacturing ISM
Further insights can be gleaned from examining the US Manufacturing and Service ISM indices. Current data shows a rebound from the troughs experienced at the onset of 2023. Importantly, the lowest points of these indices remain significantly above the crisis benchmarks of 2000, 2008, and even 2020. Despite the inflationary pressures that weighed on the US economy between 2022 and 2023, the trajectory doesn’t seem to be suitable for the label “hard landing.”
US manufacturing ISM (Trading economics)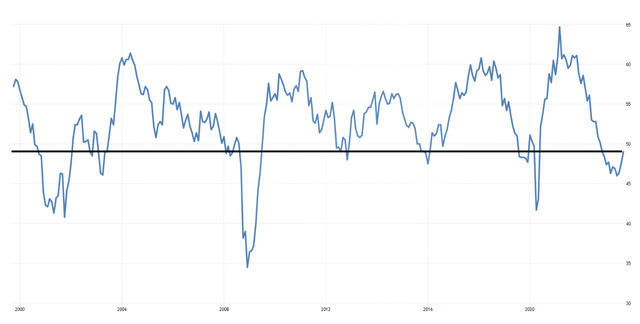
US service ISM (Trading economics)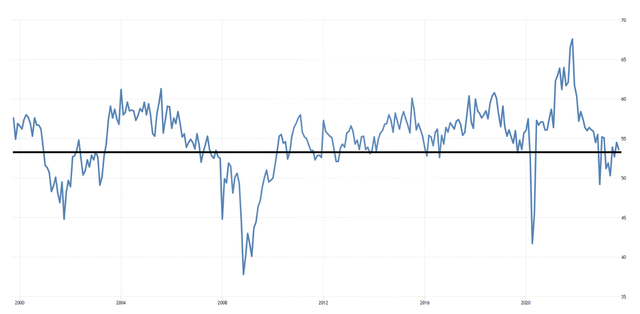
The PEG Ratio Dropped Sharply
On Sep 23, 2023, we wrote an article to evaluate the Fed’s higher for longer impact on the stock market. At the time, the S&P 500 was trading at a PEG ratio of 1.5x, which is at the higher end of the historical median.
Yardeni research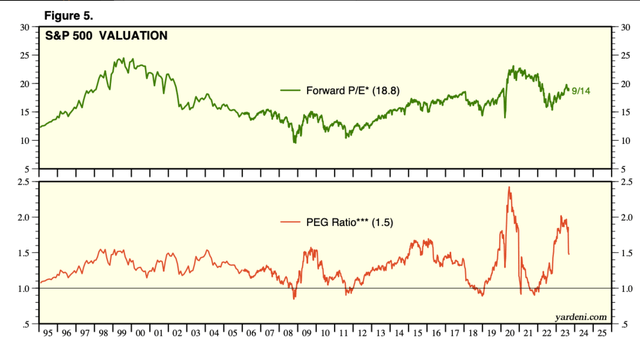
After the recent stock market turmoil, the PEG ratio has further dropped to 1.3x, more in line with the historical median. Thus, the recent correction is actually providing more margin of safety for investors who want to hold stocks in their portfolio. We will then move on to evaluating the assets if the investors feel secure holding stock in the same manner as we do.
Yardeni research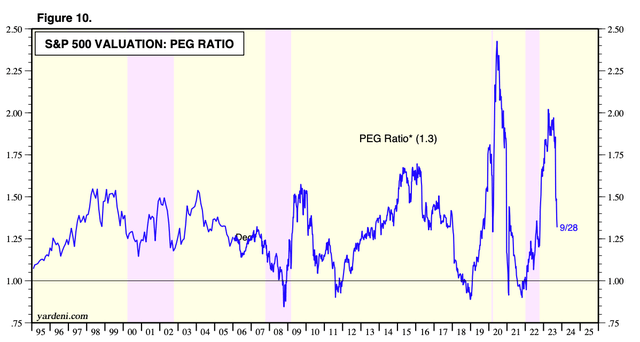
SPY vs. QQQ: A Fundamental Analysis
Below, we are going to compare QQQ and SPY from a fundamental perspective and try to answer which index is better for investors in 2024.
The below information is quoted from marketchameleon, which is different than the above sources. Thus, the data figures can be different. However, if we use this data to do a comparable analysis compared to historical averages, the data discrepancies should have less impact on our analysis.
Downside risk:
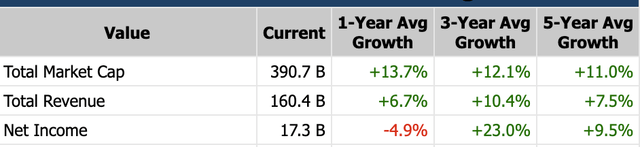
If we consider growth prospects, despite not having forward-looking data on QQQ, we can still see below that stock performance tends to trade along with revenues and earnings growth on 3 and 5-year periods.
On an absolute basis, SPY’s annual revenue and earnings growth rate surpass those of QQQ. However, when examining stock performance over 1-year, QQQ’s returns are double that of SPY. Without forward-looking data at our disposal, we can infer that QQQ potentially carries a greater downside risk than SPY. This suggests that if there’s a market correction or an unforeseen “black swan” event stemming from concerns about slowed growth in 2024, QQQ might experience a steeper decline compared to SPY.
QQQ (marketchameleon) SPY (marketchameleon)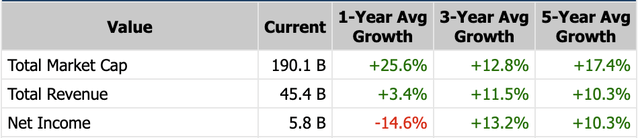
Upside potential:
- Valuation metrics and profitability ratios:
SPY’s P/E ratio is currently lower than its 3-year and 5-year average while its profitability ratios like gross margin and operating margin are better than 3-year and 5-year averages.
As opposed to this, I showed the contrary. While its profitability ratios, such as gross margin and operating margin, are worse than the 3-year and 5-year averages, the company’s P/E ratio is currently higher than its 3-year and 5-year averages.
This implied that the fundamentals of the companies in SPY are strengthening while those in QQQ are worsening.
- Capital structure and return on assets:
The capital structure and levered and unlevered return metrics became particularly significant for investors as the debt became more expensive as the Fed maintained high rates until 2024. If the company’s internal financial staff exercises discipline, every project that doesn’t match this level of IRR in the mid-to-long-term will likely not be allowed.
The cost of equity might be as high as 11% when taking into account a beta of 1, a risk premium of 6, and a risk-free rate of 5%. Both SPY and QQQ have ROEs that are higher than 11%. As a result, both indexes are investable in 2024 given that fundamentals don’t change significantly.
However, companies in SPY have a higher debt/equity ratio of 1x than those in QQQ at 0.8x. Companies in SPY also have a lower ROA of 3.7% and ROE of 17.5% than those in QQQ at 8.2% and 20.9% respectively. Due to the higher leverage of the companies in SPY and the consequently more constrained ability to raise debt for growth, SPY is less appealing than QQQ.
Hence, one possible explanation of QQQ’s current outperformance in a 1-year period is likely reflecting the expectation that its higher margins and low debt structure make it best positioned for 2024.
QQQ (marketchameleon)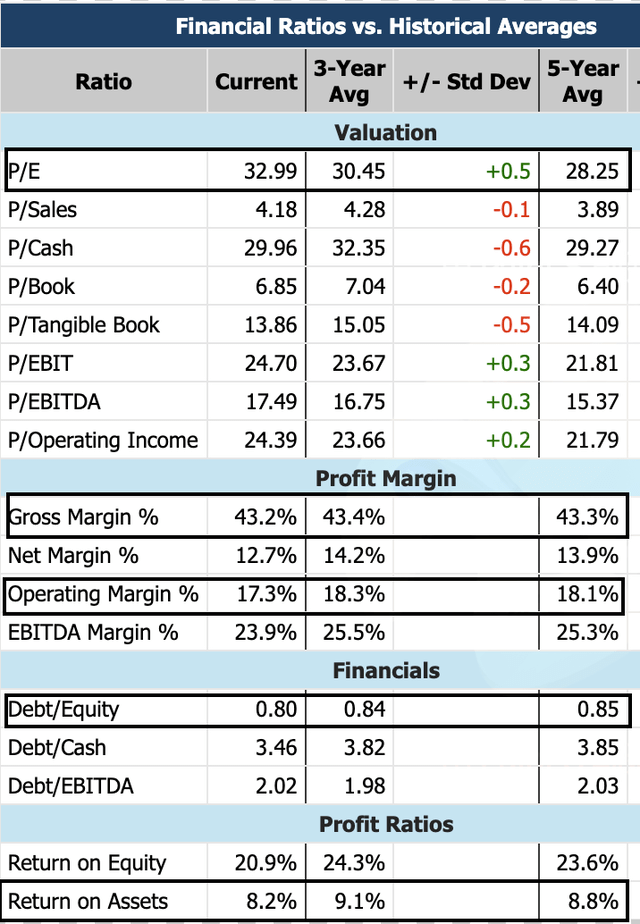
SPY (marketchameleon)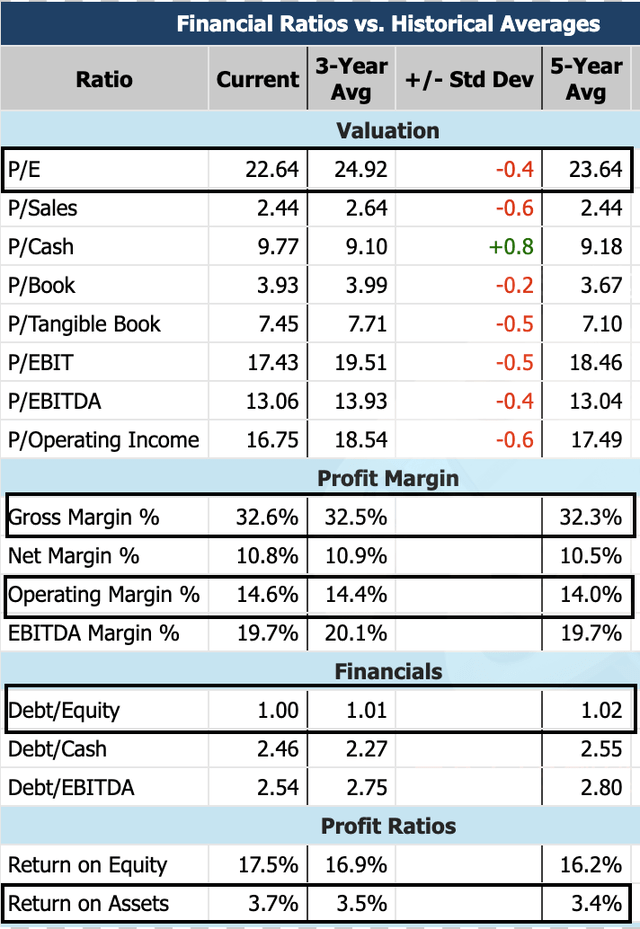
We don’t have forward-looking data on QQQ index levels available. However, if we look at the holdings level, per data downloaded from Seeking Alpha, there are 27% of companies in SPY with PEG ratios lower than 1.5x, while only 25% in QQQ have PEGs below 1.5x. There are 43% of companies in SPY with PEG over 2x while 45% in QQQ are over 2x. Despite this being simple math rather than a weighted average calculation, it can still provide some insight into growth prospects. Hence, SPY may be seen as slightly better for upside on a forward-looking adjusted basis.
QQQ (Seeking Alpha, LEL)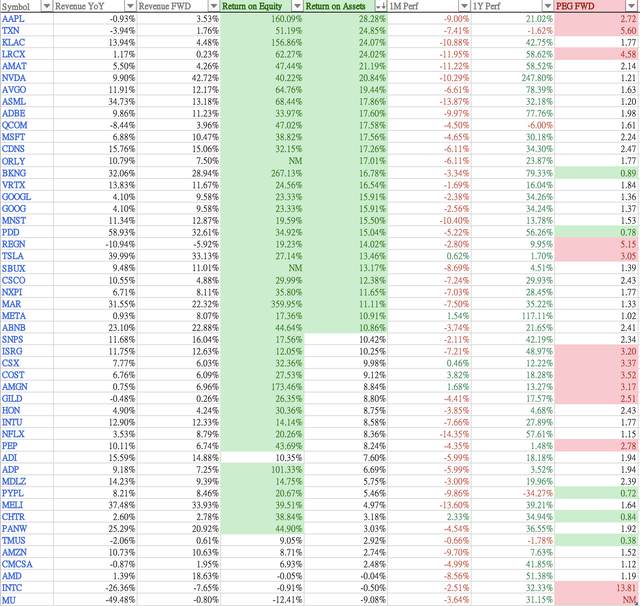
Risk Regarding the Shutdown
Social order/Crime
A problem with social order is one immediate consequence of the shutdown that might occur. The recipients of social assistance programs may experience severe distress if a shutdown interferes with their delivery. In addition to inflation, this may put further strain on low-income customers. It might also address the growing thievery/crime problem in the United States.
National Security
A government shutdown can influence the defense forces to some extent. Should China or Russia intensify geopolitical tensions, the US administration might not respond in its typical manner.
Conclusion
As the Fed is currently stepping in for the tightening work, the government shutdown is not actually as negative as credit agency suggests and may be good for combating inflation. After all, the US economy is run majorly by the private sector and government only plays a supportive role. However, there are unforeseen consequences that could lead to potential black swan events or potential severe impacts on the US economy such as crime and national security. Investors should adjust their portfolios based on their risk profile.
For investing in indices, as for now, we prefer SPY over QQQ given the upside and downside analysis above.
In addition, we hold the same conclusion from our previous article that the restrictive monetary policy environment is likely to have uneven impacts across sectors and companies. Those able to sustain growth amidst headwinds will stand out. Investors looking for better yields should spend more time on stock picking in 2024.
Read the full article here