


Written by Nick Ackerman, co-produced by Stanford Chemist.
The Fed is looking to raise at least one more time, and with the new projections of fewer cuts in 2024 than previously expected, that pushed the risk-free rate to new heights in this latest rate cycle. That has put pressure on equities and fixed-income investments once again. In particular, income-focused investments have been under some of the most notable pressure. As they are seen as income investments, when risk-free rates rise, that pushes investors into these safer assets.
Real estate investment trusts (“REITs”) have been a notable underperforming space to put capital to work. However, for a longer-term investor that can look over the next one to two years, that’s where opportunities can come as well.
For today, I wanted to give the Cohen & Steers REIT & Preferred Income Fund (NYSE:RNP) a fresh look. Last year, the fund began to trade at a premium, and that’s when I exited my position. However, it’s looking like a much more tempting offering these days.
The Basics
- 1-Year Z-score: -1.75
- Discount: -8.18%
- Distribution Yield: 9.96%
- Expense Ratio: 1.16%
- Leverage: 32.47%
- Managed Assets: $1.39 billion
- Structure: Perpetual
RNP’s objective is “high current income,” and a secondary objective of “capital appreciation.” To achieve this, they invest just as their name would suggest; “investment in real estate and diversified preferred securities.” They will invest in both U.S. and global positions. Most of the portfolio has been held in the U.S. or North American investments.
The fund utilizes leverage in the form of borrowings; when including those expenses, the fund’s total expense ratio comes up to 3.82%. That’s significantly higher than the 2.21% we saw at the end of fiscal 2022 and the 1.78% at the end of 2021. The reason for this is that the fund’s leverage is based on a floating rate. As the Fed has raised rates aggressively, this has caused their borrowings to rocket higher as well.
Fortunately, Cohen & Steers put hedges in place. They are hedged against those costs on a majority of their outstanding leverage for the next few years. They’ve utilized interest rate swaps to essentially lock in a much lower rate than the ~6%+ rate that is common right now on the variable rate portion.
RNP Leverage Facts (Cohen & Steers)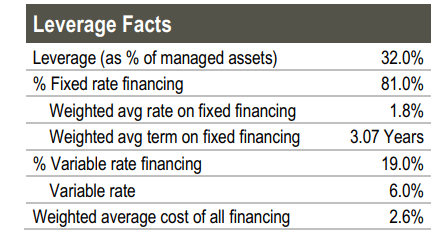
Gaining REIT And Preferred Exposure At A Discount
This fund is invested in both REIT equities and a sleeve of preferred securities as well, primarily related to the financial sector. Generally speaking, the preferred securities would be seen as safer relative to equity positions. However, they are interest rate sensitive and prone to their own disadvantages, too. We saw in March, during the banking collapses, that preferred – even investment-grade preferred – can go to just about zero really quickly.
Assuming that REITs are looking attractively valued here, as I certainly do, RNP also offers investors its own discount as a CEF. This comes in the form of the current share price trading below the fund’s actual net asset value per share.
The fund had been trading at a rich premium last year. The catalyst to drive that event was most likely the large year-end special distribution that they paid out in December. Heading into the ex-distribution date, the shares ramped up higher.
However, investors paying attention had the opportunity to cash out prior to the payout and receive even more as the fund dropped after the ex-date, which is often expected for large one-time specials. Today, the fund’s discount is right near its longer-term average.
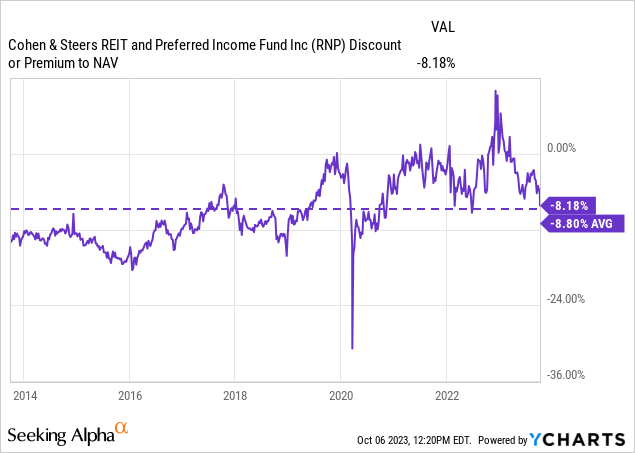
In hindsight, with REITs continuing to be pressured, the price just kept getting ‘better,’ too. With the fund now trading closer to its long-term average discount, it looks like a more tempting offering for picking up a position.
When I originally made that switch out of RNP, I had swapped to its sister funds, Cohen & Steers Real Estate Opportunities and Income Fund (RLTY), the newest offering, and also added more to my Cohen&Steers Quality Income Realty Fund (RQI) position. So, I certainly still participated in the downward REIT slide; however, due to valuation differences, the drop was felt considerably less.
It was on December 2, 2022, that I made the switch. We can see that all three funds had mostly identical total NAV return performances during this time. RQI actually performed even worse than RNP, but on a total share price return basis, RNP was the worst performing due to its heightened valuation.
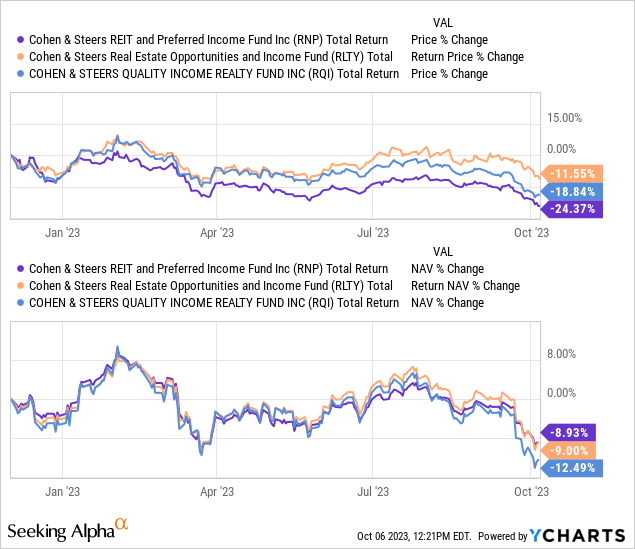
All three funds remain relatively attractive bargains where they trade today, in my opinion. RLTY offers the best discount, but RNP isn’t too far behind at a still attractive discount.
Distribution Steady And Pushing To 10%
RNP has a long history of paying a fairly stable distribution. RNP and RQI both cut during the global financial crisis when they switched from monthly to quarterly payouts. They then reverted to monthly distributions once again. During that time, they raised the distribution a few times as well, but even today, the monthly rate isn’t as high as pre-GFC.
RNP Distribution History (CEFConnect)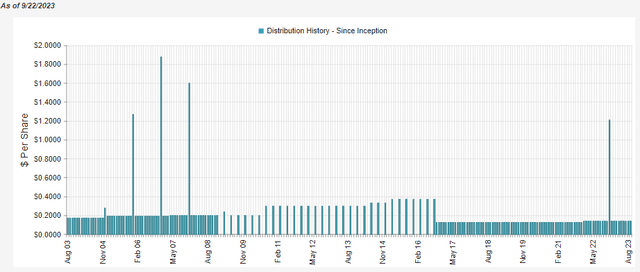
The fund currently sports a 9.96% distribution rate, which is certainly attractive. The fund’s discount also means that it has a lower NAV distribution rate of 9.15%. It isn’t necessarily the highest or most concerning yet, but it is something to watch. Similar to most equity or hybrid funds, such as RNP, it will require capital gains in the future to continue to support such a payout. The underlying holdings that it carries aren’t paying those sorts of dividends.
As of their last semi-annual report, net investment income coverage was coming in at around 48%. The distributions paid out last year to common shareholders also reflect the special; when factoring that out, the NII distribution coverage would have come in at around 54%.
RNP Semi-Annual Report (Cohen & Steers)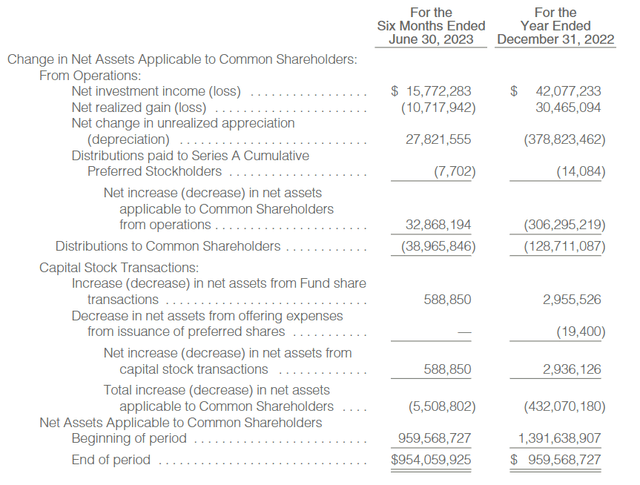
One of the reasons for the decline besides portfolio changes could be seen in the higher interest expenses for the fund’s borrowings. In this six-month report, the interest expense came to $12.728 million. For the same period last year, interest expense came to only $4.285 million. That means the expense has nearly tripled.
However, going back to the hedges that they’ve put into place is good news. This is where they took a hit on NII, but they made up for it mostly with realized gains from interest rate swaps.
RNP Realized/Unrealized Gains/Losses (Cohen & Steers)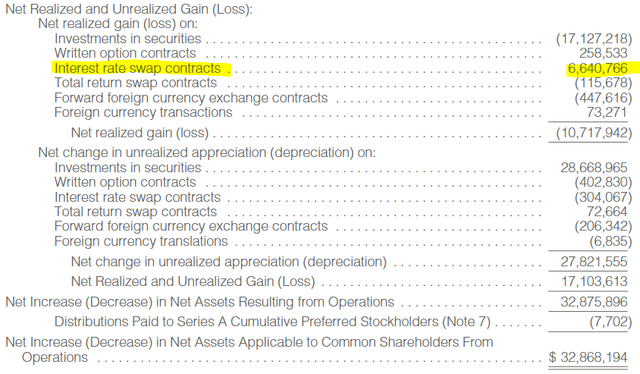
They’ve also utilized other various derivative strategies with mixed results, such as losses from total return swaps and losses from forward foreign currency exchange contracts – though they saw gains from options writing. The fund utilizes covered calls but also writes put contracts, too.
At the time of that report, they were sitting on a sizeable amount of unrealized appreciation still left from their interest rate swaps as well, pushing close to $36 million. Given that the Fed bumped up rates again another 25 basis points, all else being equal, the value of these would have increased again. Though a few of these contracts have matured now, that shouldn’t have changed much since they had limited unrealized appreciation left anyway.
With the Fed anticipated to have at least one more raise in them, these contracts could see further appreciation in the future.
RNP Interest Rate Swaps (Cohen & Steers)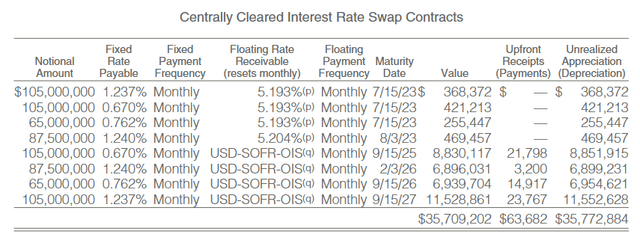
For now, I suspect the payout should be fairly safe, but as the NAV rate gets closer to 10%, I’d be more suspicious.
Looking at the tax character of the distributions, they’ve mostly been comprised of ordinary income and long-term capital gains in both of the prior years.
RNP Distribution Tax Classifications (Cohen & Steers)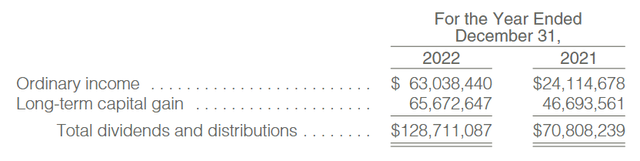
RNP’s Portfolio
RNP is generally split roughly 50% in equity REITs and 50% in preferred. This is generally even the case despite the fund being fairly active. In the last six months, the fund’s turnover rate came to 15%. In each of the previous two fiscal years, the fund’s turnover rate came in at 40%.
In looking at the sector allocation of each sleeve, they have clearly diversified broadly on the REIT side of their portfolio.
RNP Sector Exposure (Cohen & Steers)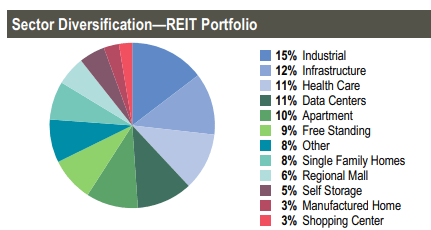
However, on the preferred side, the fund is dominated by financial institutions within the banking or insurance space. Preferreds are often issued by financial institutions to help them meet regulatory requirements. These are going to primarily be non-cumulative perpetual preferred to have them count as part of Tier 1 Capital.
RNP Preferred Exposure (Cohen & Steers)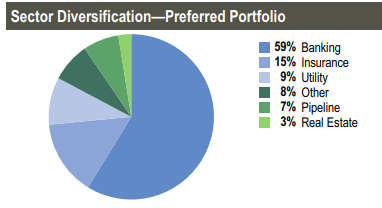
So, while they offer the basic protection of being higher in the capital stack relative to common shareholders, some of the other features found in preferreds in other sectors are missing.
In total, RNP carries 328 positions and, due to its more even split between equity REITs and preferred, appears to be the most diversified relative to its sister funds. RQI lists 227 holdings, and RLTY is at 207. This broader diversification can also be reflected in the fund’s top ten, representing 31.2% of the fund’s portfolio. For RQI, the top ten comes to a weighty 50.2%, and for RLTY, we see the top ten representing 41.7%.
RNP Top Ten Holdings (Cohen & Steers)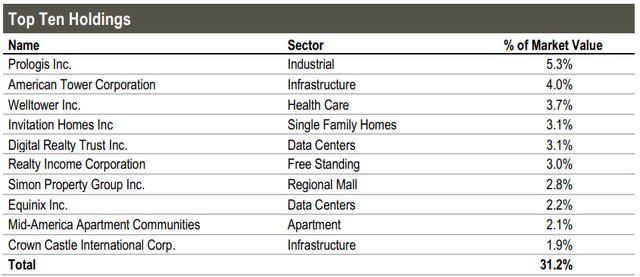
At the same time, if you compared the top ten names, you’d notice some significant overlap.
For RNP, since our last update, we see that Crown Castle (CCI) has made its way onto the top ten holding list. This had edged out Public Storage (PSA) during the reporting periods. The top ten above are as of June 30, 2023, and our previous update was looking at the end of March 2023. That being said, PSA remains a position. They’ve just seen their share count go from 93,604 in the portfolio down to 43,148.
Conclusion
RNP is getting back to a discount that makes it more tempting for the long-term investor. This appears to be a decent time to consider potentially utilizing a dollar-cost average approach while the fund is discounted. REITs have remained under pressure, and the discount for RNP provides for an added value.
On the other hand, RLTY and RQI could represent better options, in my opinion. Their current discounts are even deeper, mostly seeing similar results in shorter periods. That said, one would also have to be comfortable assuming higher equity REIT allocations. RQI is around 80% in equity REITs, and RLTY is at roughly 67%. This means they offer some differences upon a closer look and aren’t the exact same funds, even with the significant overlap of holdings on the surface.
Read the full article here