

Analysis Summary
Today I’ll be covering Kohl’s (NYSE:KSS), in the consumer discretionary sector, subsector of broadline retail.
According to its Seeking Alpha profile, it trades on the NYSE, is based in Wisconsin, and offers branded apparel, footwear, accessories, beauty, and home products through its stores and website.
One of its listed peers is Macy’s (M). Both chains have been common sights in the years I have been visiting large malls in the US, and takes the buyer on a brand experience from beginning to end as soon as you are inside. At the same time, it is the digital era so they have cultivated a brand experience online as well.
In today’s article, I gave this stock a buy rating, due to having more strengths in my review than offsetting factors. In fact, it had 4 strengths vs just 3 offsetting factors.
Its strengths include the dividend yield, low valuation, capital and liquidity strength of the company, and the share price trading below 200-day moving average.
Its offsetting factors include revenue YoY decline, net income and EPS YoY declines, and underperformance vs the S&P500 index.
A downside risk to my bullish outlook is the high interest-rate environment which I will discuss towards the end of the article.
Methodology
My rating methodology is to analyze the stock holistically across the following 7 categories of equal weight, and if it has more strengths than offsetting factors it gets a buy rating, otherwise will get a hold or sell rating:
dividends, valuation, revenue growth, net income and EPS, capital and liquidity, share price vs moving average, performance vs S&P 500.
All data sources come from publicly available info such as the most recent quarterly report and company presentations, Seeking Alpha data, and media reports. The next quarterly earnings release is expected in November for fiscal 2023, Q3. Its most recent release, for fiscal Q2 that ended in July, came out on Aug. 23rd.
Dividends
Here I discuss the dividend yield, 10-year dividend growth, and dividend stability over the last few years. As a dividend-focused analyst and investor, I believe these are vital metrics to look at.
Though not all investors are dividend-oriented, including many of my readers, I do think generally-speaking it can be a way to generate cashflow while holding an equity longer-term.
First, let’s look at the dividend yield, which is the most attention-grabbing yield I have found this year so far!
The yield sits at a whopping 10.70% as of the writing of this article, along with a dividend payout of $0.50 per share, on a quarterly basis. Because the yield got my attention, this stock will be added to my “dividend quick picks” of the week!
Kohls – dividend yield (Seeking Alpha)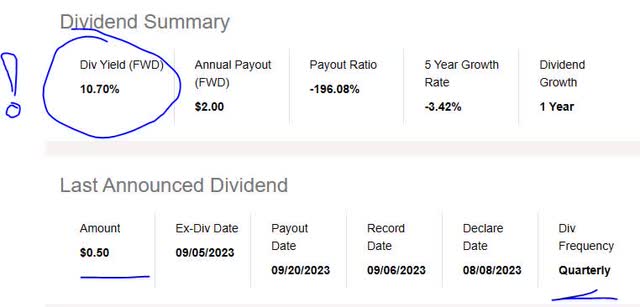
Whether or not I think it is a good yield depends how it compares to the industry it is in, and not to other industries.
In comparison to its sector average, this yield is nearly 308% above the average. I consider this a positive point as I am looking for a yield in line with the sector average or above it. With that said, my target for a yield would have been 5%, so this stock has a yield that is higher than my goal.
I consider yield important because it tells me a story: how much of a return I am getting on the capital invested, in terms of dividend income. A sudden drop in share price, as you may know, can result in a higher yield if the dividend amount remains the same. So, the fact that this yield is nearly 11% warrants further investigating into the share price, which I will do later in this article.
Kohls – dividend yield vs sector (Seeking Alpha)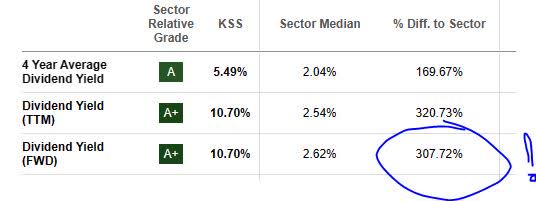
Next, I am looking at the 10-year dividend growth rate, shown in the chart below, which shows a trend of steady growth over many years followed by a dip in 2020, then a recovery and growth again.
I think that the trend rebound is a positive point and I always look for a good dividend growth story to tell, backed by the data. The story here is one of a return to growth after a period of dividend sluggishness.
Kohls – dividend 10 year growth (Seeking Alpha)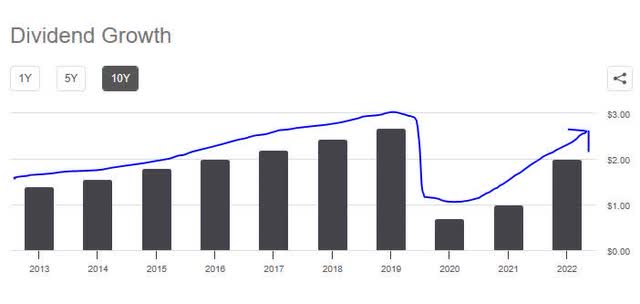
Finally, I want to see dividend payout stability, especially if you are relying on the steady quarterly cashflow.
Let’s not forget that a major pandemic in 2020 had an impact on shopping at malls, and therefore a business impact on retailers like this one.
In looking at the table below, you can see stable payouts over the last few years after the 2021 recovery, with one dividend increase in this time period. A cashflow scenario: if I was holding 1,000 shares, for example, I could realize $500 in quarterly cashflow from the dividends on this stock. (1,000 shares x $0.50 per share.)
Kohls – dividend stability (Seeking Alpha)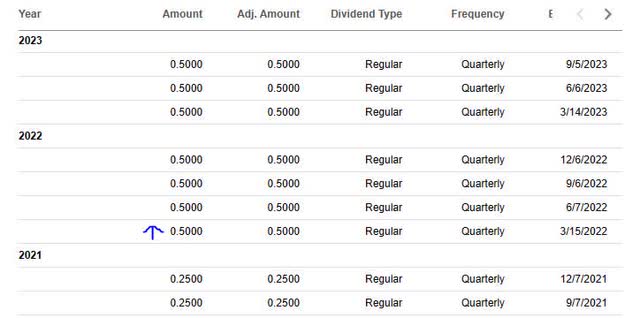
Based on the evidence, I consider the category of dividends a strength for this stock, on the basis of recent steady dividend payouts and a return to modest dividend growth after a very difficult period for the retail sector, but also an exceptionally high dividend yield.
Valuation
To simplify analyzing the valuation, I have chosen a single metric to focus on, and that is the price-to-earnings ratio (P/E), both the trailing and forward P/E, as it tells me what the market is pricing this stock at in relation to its earnings.
My portfolio goal is to find a valuation lower than or close to the sector average, but not too much higher. Sometimes a stock is undervalued but otherwise has strong fundamentals, so that is a company I want to uncover.
Kohls – PE ratio (Seeking Alpha)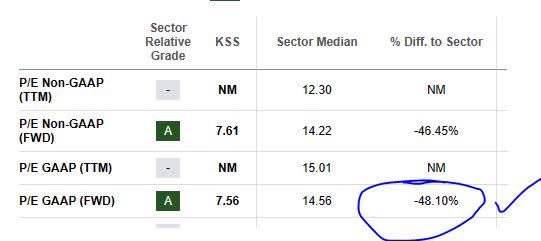
In the case of this stock, the trailing P/E does not appear to be covered, however the forward P/E of 7.56 is 48.1% below the sector average.
Hence, I would consider this stock undervalued compared to its industry.
If you compare its valuation to that of its retail peer, Macy’s, that firm’s forward P/E is almost 71% lower than the sector, so it is an even lower valuation than Kohl’s, and also perhaps worth taking a look at if one were building a portfolio of stocks in this sector.
Based on the data, I think this valuation metric is a strength for Kohl’s stock. As far as driving forces behind the low price to earnings, we will discuss the company’s earnings in the next few sections as well as the share price which appears to be mostly trading below the 200-day moving average for a large portion of the year. Essentially, the market is undervaluing this stock for a reason in my view.
Revenue Growth
One topic many analysts and investors look at is the top-line revenue growth, as a metric tracking revenue generated before expenses, to put it simply.
Manageable growth is important, in my opinion, because companies have competition and are striving to capture market share in their sector.
For this company, we can see from the most recent quarterly results that it achieved a YoY decrease in total revenue:
Kohls – total revenue YoY (Seeking Alpha)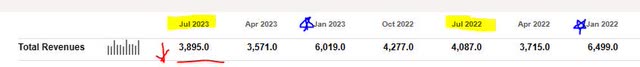
At first glance, I think this is a minus for this company. However, it is also important to mention the seasonality of this type of business, and it shows in the numbers as the fiscal quarters ending with January are showing the highest revenue, traditionally the fiscal quarter with the holiday shopping season (November through January).
When diving into company comments on the Q2 performance to make sense of headwinds, we see a bit of a clearer picture:
Net sales declined (4.8%) versus Q2 2022 & comparable sales declined (5.0%)
Gross margin decreased (61) bps compared to last year driven by product cost inflation and higher shrink.
Overall, I think the data shows that top-line revenue YoY growth is an offsetting factor for this stock’s rating.
Net Income and EPS
Net income and earnings per share are getting their own section here to make the analysis easier to understand and to separate these results from top-line revenue.
Based on the most recent quarterly results available from its income statement, this firm achieved a YoY drop in net income and the basic earnings per share decreased on a YoY basis.
Kohls – net income and EPS (Seeking Alpha)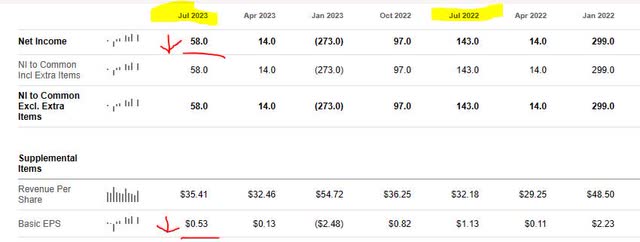
On the expense front, one thing I want to call out is the $89MM in interest expense the company incurred in Q2. If you look at the following table, that is a significant uptick from the interest expense in Oct 2021, to the tune of a 35% increase!
Kohls – interest expense (Seeking Alpha)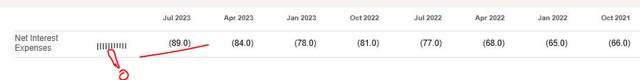
I think that, given the elevated interest-rate environment we are still in, this could still continue to pose headwinds to expenses going forward as well.
Also, although I mentioned the quarter ending January is usually peak holiday sales season, this firm posted a net loss that quarter as you can see in the net income table, but was able to recover and become profitable again in the next two subsequent quarters.
Going into fiscal Q3, the major retail driver will be the back-to-school sales. However, this upcoming holiday season will be worth keeping an eye on, and official data on consumer spending after it comes out.
I think, therefore, that this category of net income and EPS is an offsetting factor for this stock’s rating until the YoY profitability improves.
Capital and Liquidity
Here we’ll focus on one or more items related to capital and liquidity strength of this stock’s parent company.
The following is relevant data from the company’s quarterly presentation, which I have consolidated to discuss both balance sheet and cashflow at the same time.
Kohls – balance sheet and cashflow YoY (company Q2 presentation)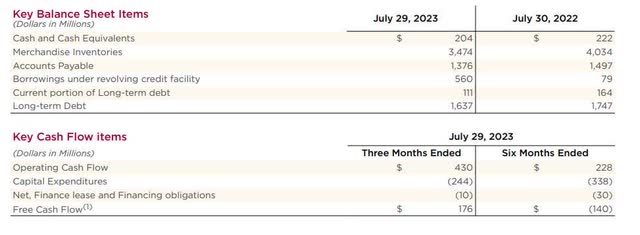
In the above table, the story it tells about this company is that its cash position at $204MM is high but slightly dropped on a YoY basis. The thing to call out is the YoY drop in long-term debt down to $1.6B. In addition, Q2 saw the company achieve free cash flow of $176MM, also a positive in my opinion.
From the graphic below, we can also see that the company is remaining committed to dividend payouts, as well as investing in or expanding stores along with its strategic partnership with Sephora. Keep in mind this is a very capital-intensive business, running hundreds of retail locations and the overhead required.
They also seem to be committed to strategic debt reduction, which I think is always good in my book, and on the downside though they are not planning further share repurchases just yet.
Kohls – capital priorities (company Q2 presentation)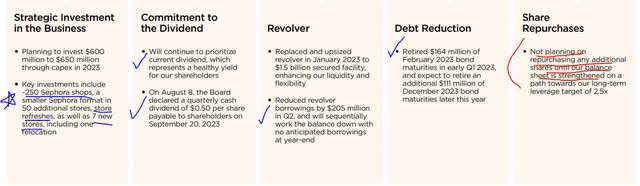
Based on the evidence found, I consider this firm’s capital and liquidity situation a strength to its overall rating, with positive cashflow leading the way in this category.
Share Price vs Moving Average
Now we’ve come to the part where I like to talk about the share price and whether I think it’s a buying opportunity right now or not.
First, let’s take a look at the share price and 200-day moving average as of the writing of this article:
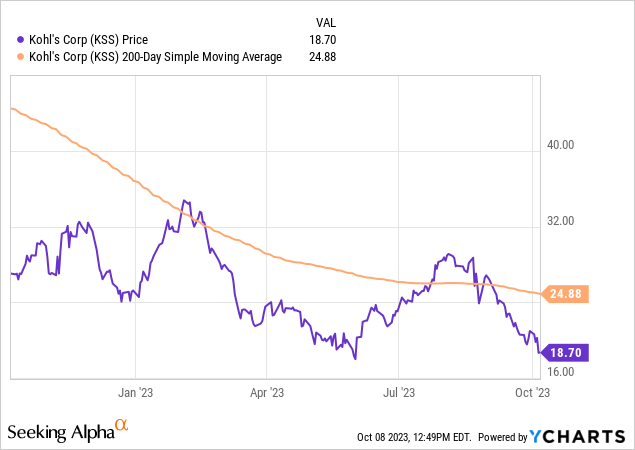
The share price of $18.70 is 33% below the 200-day SMA which stands at $24.88. I think this moving average is a good long-term trend indicator which is why I track it.
In my portfolio goal, I am looking for crossover opportunities, where the price crosses below the moving average after a period of bullishness, which I consider a buy signal as long as other fundamentals are strong. However, a buy opportunity could also exist if the price is hovering around the moving average.
This chart shows a crossover below the average already occurred this summer, followed by a bearish trend.
To test the share price against my portfolio goals I created the following simulated trade scenario. I would buy 100 shares at the current price, hold 1 year, and want to achieve at least a 10% or better (unrealized) capital gain at that time.
In addition, in anticipation of losses as well, I have set my maximum loss tolerance as -20% (unrealized capital loss).
Kohls – trading simulation (author analysis)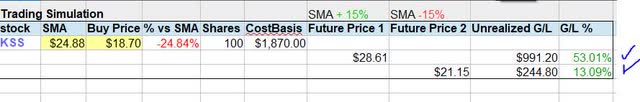
The above simulation shows two scenarios, one where the future share price rises +15% above the current 200 day SMA, and the other where it drops -15% below the SMA.
The outcome of both scenarios is that they are in line with my goals for gains and losses. For example, in the first scenario my projected gain is 53.01%, whereas in the second scenario the projected gain is 13.09%. Neither scenario projects a capital loss. Keep in mind these are just projections if the future share price rises or falls by a certain percent, and actual results may vary widely.
However, based on this simulation, this stock fits my risk profile and I think the current share price is a strength, offering a value-buying opportunity.
Though your portfolio strategy may differ, consider this section a general and simplified framework with which to think about this stock in a longer-term sense, in which time one can expect potential gains as well as losses, so establishing a maximum risk tolerance is important.
Performance vs S&P 500
The following is a comparison of the 1-year price performance of this stock vs the S&P 500 index. I have included this metric in my updated rating methodology so as to compare this equity to a major market index that is tracked often, and whether it was able to outperform it or not.
I consider this relevant because it shows the market momentum for this stock. It may be a great company fundamentally, the market reality is that other investors influence the share price based on demand for the stock, so comparing it to this major index could add some clues as to market sentiment.
Kohls – performance vs S&P500 (Seeking Alpha)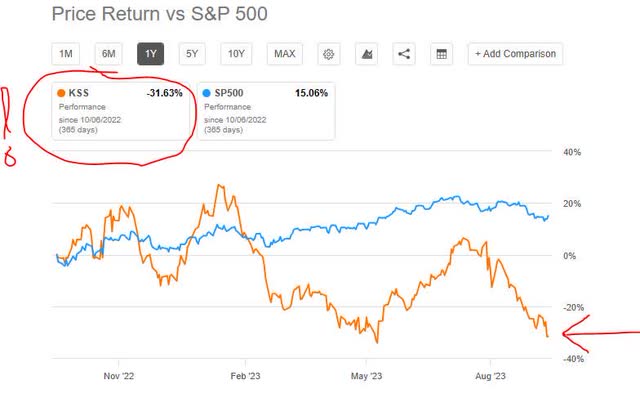
The data shows the stock underperforming vs this index, which I consider an offsetting factor to my rating, as I believe it to indicate a bearish market sentiment for this stock for a large part of 2023. Back to the earlier discussion on valuation and it seems to fit with this chart, indicating the market is undervaluing this stock. I think the net loss they posted earlier in the year probably did not help their case, either.
Risk to my Outlook
A downside risk to my bullish outlook could be related to the high interest-rate environment of the last year which is not retreating just yet, after the most recent Fed meeting kept its policy rate the same.
This could pose continued bearishness from analysts and investors concerned about the debt load and rising interest expense incurred by Kohl’s, and the retail sector in general particularly companies that are extremely leveraged. Remember we discussed earlier that it is a highly capital-intensive business to run. It also spells higher credit costs for consumers who shop with credit cards.
In the comments section, I welcome your thoughts on whether you think consumers will spend less this holiday season at stores like this due to the cost of credit?
It could have an impact since this business thrives on consumer sales and getting its inventory out the door.
However, I think that the study from Adobe Analytics published this month by marketing industry group MarTech.org points to e-commerce /digital spend as the saving grace of the retail industry this coming holiday season.
According to the article:
This year’s holiday season, running from Nov. 1 through Dec. 31, will see 4.8% growth YoY in online spending.
Adobe expects over $220 billion in online sales this year. Buy Now Pay Later is expected to drive some $17 billion in sales. Electronics, apparel, furniture and home goods, groceries and toys will drive more than half the overall ecommerce spend this year.
Consider also that, according to its Q2 presentation, Kohl’s has a very strong digital / eCommerce presence already, so I think the forecast mentioned should work in its favor. However, we won’t see the holiday and Cyber Week sales data likely for a few more quarterly reports, so stay tuned!
Kohls – digital presence (company q2 presentation)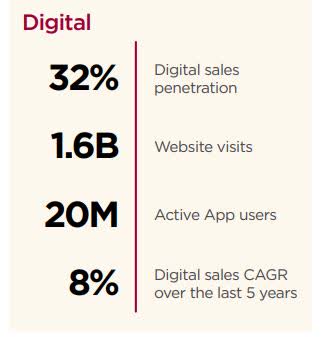
In closing, my bullish sentiment on this stock remains and my buy rating stands. While many other mall-based retailers have disappeared in recent years and some did not survive the pandemic of 2020, Kohl’s is still kicking and I am glad consumers across America still have another place they can go buy clothes at, but at the same time am glad that investors and analysts like myself can add a retail giant like this one to our portfolio, due to the value proposal it offers.
As mentioned already, I am adding this equity to my dividend quick picks of the week for having the highest dividend yield of all articles I have covered this year.
Read the full article here