


It has been close to two years since I presented a mostly skeptical analysis of the Invesco S&P SmallCap Value with Momentum ETF (NYSEARCA:XSVM), a fund with a strategy built around a combination of seemingly contradictory concepts of underappreciated equities and robust price performance.
According to the Invesco website, the basis for XSVM’s passive strategy is the S&P 600 High Momentum Value Index. The benchmark encompasses 120 constituents of the S&P 600, a well-known small-cap echelon barometer, selected using value and momentum scores, with the most undervalued names receiving greater weights. According to the prospectus, the following metrics are used:
In selecting constituent securities for the Underlying Index, the Index Provider first calculates the value score of each stock in the Parent Index by evaluating each stock’s: (i) book value-to-price ratio, calculated using the company’s latest book value per share divided by its price; (ii) earnings-to-price ratio, calculated using the company’s3 trailing 12-month earnings per share divided by its price; and (iii) sales-to-price ratio, calculated using the company’s trailing 12-month sales per share divided by its price…
The Index Provider calculates a security’s momentum score by evaluating the percentage change in the stock’s price over the last 12 months, excluding the most recent month, and applying an adjustment based on the security’s volatility over that period.
Reconstitution and rebalancing follow a semi-annual schedule (June and December).
Today’s note is supposed to provide a balanced overview of the ETF, as an update has been long overdue. More specifically, I would like to not only present a few bullish arguments that optimists might leverage in their buy theses on the vehicle but also counter them with some bearish facts that, at the end of the day, persuaded me not to upgrade the rating.
Bulls have a lot to say
Robust performance since the index change
A note of caution is that despite XSVM’s returns tracing back to its inception in March 2005, they are of no use for the most part as the fund changed its underlying index in June 2019. In this regard, I would like to pay attention only to the July 2019-October 2023 period.
So, the performance story the fund has delivered is nothing short of robust. Below is the total return it clocked, as well as a few other relevant metrics, compared to the results of the iShares Core S&P 500 ETF (IVV) and iShares Core S&P Small-Cap ETF (IJR). I also decided to add its peers targeting mid-cap and mega/large-cap echelons, namely the Invesco S&P 500Value with Momentum ETF (SPVM) and Invesco S&P MidCapValue with Momentum ETF (XMVM).
| Portfolio | XSVM | IVV | IJR | XMVM | SPVM |
| Initial Balance | $10,000 | $10,000 | $10,000 | $10,000 | $10,000 |
| Final Balance | $16,492 | $15,307 | $12,126 | $14,069 | $12,644 |
| CAGR | 12.24% | 10.32% | 4.55% | 8.20% | 5.56% |
| Stdev | 30.65% | 18.55% | 23.84% | 25.92% | 22.41% |
| Best Year | 55.89% | 28.76% | 26.60% | 34.72% | 28.40% |
| Worst Year | -13.64% | -18.16% | -16.19% | -8.23% | -4.14% |
| Max. Drawdown | -40.97% | -23.93% | -32.77% | -35.24% | -34.22% |
| Sharpe Ratio | 0.48 | 0.53 | 0.23 | 0.37 | 0.28 |
| Sortino Ratio | 0.73 | 0.81 | 0.34 | 0.54 | 0.38 |
| Market Correlation | 0.8 | 1 | 0.9 | 0.88 | 0.87 |
Data from Portfolio Visualizer
Neither the market proxied with IVV, nor IJR, nor peers were able to outcompete it. Yet there are still a few nuances that will be addressed shortly.
Besides, in the group of value ETFs I cover, XSVM’s hybrid value/momentum approach demonstrated one of the strongest price returns over the 3-year period, delivering almost 61%, with the closest results being the actively managed Avantis US Small Cap Value ETF’s (AVUV) 60.37% and Vanguard U.S. Value Factor ETF’s (VFVA) 45.96%. Regarding the total return, it is in second place, as it trailed AVUV by a few bps.
| Ticker | 3Y total return |
| AVUV | 68.59% |
| XSVM | 68.14% |
| VFVA | 56.08% |
Data from Seeking Alpha
Phenomenal value factor exposure
With hawkish monetary policy being front and center once again, investors have a plethora of reasons to maintain sizable exposure to value stocks, as they are, in theory, less sensitive to the interest rates eating into growth premia (or, another way of saying, the increasing cost of equity).
Here, bulls might confidently say that XSVM delivers on the value front. Below are a few facts to corroborate.
| Metric | 7-Nov |
| Market Cap | $1,812 million |
| P/S | 0.9 |
| EY | 12.92% |
| Quant Valuation B- or higher | 67% |
| Quant Valuation D+ or weaker | 7.2% |
Calculated using data from Seeking Alpha and the fund; financial data as of November 8
More specifically, XSVM’s 113-strong portfolio is not only concentrated in small caps, with a weighted-average market cap significantly below $2 billion (even though slightly more than a third of the net assets are allocated to midcaps). It also has a P/S of just 0.9x, which is not coincidental assuming 74.7% of its holdings have that ratio below 1x. The earnings yield is spectacular. Even with the impact of Ambac Financial Group (AMBC) and Community Health Systems (CYH) removed, the EY will still be solid at 11.6%.
| Ticker | EY |
| AMBC | 82.8% |
| CYN | 70.2% |
Calculated using data from Seeking Alpha and the fund
Most importantly, its exposure to stocks with a B- Quant Valuation rating or higher is one of the largest among the funds I have covered to date.
Bears are retorting
Be prepared for excruciating volatility
Obviously, investors should expect wild price swings from a fund with ‘momentum’ in its name. XSVM is not an exception. And with volatility factored in, its performance is not as attractive as it seems. A standard deviation of 30.65% and the maximum drawdown of almost 41% are telling.
Moreover, XSVM can lose much more than 10% a month easily. Let me contextualize this with IVV and IJR.
| Ticker | Above 10% total return | Below (10)% |
| XSVM | 6 | 4 |
| IVV | 2 | 1 |
| IJR | 3 | 1 |
Calculated using data from Portfolio Visualizer
My analysis showed that over the July 2019-October 2023 period, XSVM had six months with an over 10% total return and four months when it was down by more than 10%. And even IJR cannot match it here, let alone IVV.
Besides, in December 2021, I said that its “meteoric growth will be hard to replicate.” I gave the following answer to the question about whether XSVM was “on the brink of another banner year”:
Not necessarily. I believe sterling 2021 is more of a deviation, and 2022 should be way less spectacular, as numerous headwinds from persistent inflation are clouding the outlook for the small-cap league, while tailwinds that undergirded its alpha returns earlier this year have mostly lost steam.
It seems that I was right, as after a 55.89% total return in 2021 (mostly the consequence of just two months, January with 23.37% and March with 13.44%), it dropped by 13.64% in 2022 and then advanced by a meager 41 bps in 2023. As a consequence, it significantly underperformed the S&P 500 index.
Seeking Alpha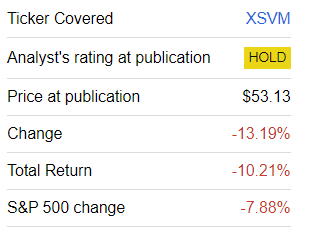
High turnover is to be tolerated
XSVM’s portfolio changes drastically over time, not because of the frequent reconstitution (there is a biannual schedule), but due to the selectiveness of the methodology. In this regard, an 86% turnover does not come as a surprise. To give a bit more color, only 40% of the fund’s current holdings were present in the portfolio as of December 10, 2021. Simply put, investors should be prepared for remarkable shifts in exposures.
Numerous EPS contraction stories
In the current iteration, XSVM has a large allocation to companies that are forecast to deliver lower earnings per share going forward, around 36%.
| Fwd EPS | Fwd Revenue |
| 10.8% | 4.73% |
Calculated using data from Seeking Alpha and the fund
Its weighted-average forward EPS growth rate is mostly supported by just four stocks. With their impact removed, it will drop to 4.7%.
| Stock | Weight | Sector | Fwd EPS |
| Wabash National Corporation (WNC) | 0.5% | Industrials | 437.94% |
| Apogee Enterprises (APOG) | 0.6% | Industrials | 214.38% |
| NOW (DNOW) | 0.9% | Industrials | 130.91% |
| CONSOL Energy (CEIX) | 1.4% | Energy | 103.91% |
Data from Seeking Alpha and the fund
Also, about a quarter of holdings have a D+ EPS Revisions grade or lower, which implies analysts have become more bearish on their profits.
Quality: expectations should not be set too high
Something that does not change over time is XSVM’s rather soft quality. In the previous note, I mentioned that “only around 41% of its portfolio is allocated to stocks with solid Profitability grades.” This figure has risen to almost 53% since then but still remains well below a comfortable level of 80%. In its defense, I should mention that the fund has an overall healthy Return on Assets of 7% and only small exposure to cash-burning companies (7%).
Final thoughts
XSVM’s unique factor approach is supposed to be an answer to the chronic underperformance of value strategies. To a certain degree, it did achieve that, but at the expense of high turnover and painful volatility. I truly like XSVM’s value profile, but due to disadvantages discussed above, there will be no rating upgrade today.
Read the full article here