

On 14 November, the Russell 2000 (IWM) had what I refer to as a “Power Day” – returning more than 5% in a single day. In this case, the index returned a whopping 5.48%, compared to the S&P 500’s 1.91%.
Since 2000, there have only been 29 days where the smallcap index has reached 5% or higher. In other words, this only happens once every 202 days (or 0.4% of the time), or once a year on average.
Smallcaps have been lagging, with the R2000 returning only -4.2% the last year, compared to the S&P 500 (SPY) of 13.9%, and nowhere close to the Nasdaq’s (QQQ) 26.1%.
As the R2000 is considered a benchmark for small and microcap stocks, after this Power Day (following a favorable CPI print), some pundits are speculating that the “bottom is in” for smallcaps.
Let’s look at the history of Power Days and see if we can glean any hints into the future.
The Russell 2000
Before getting into Power Days, let’s take a closer look at the Russell 2000. While considered the market benchmark for smallcaps, the index has some interesting features that some would argue make it a poor benchmark.
Strictly speaking, the R2000 simply consists of the 2000 smallest stocks of the broader Russell 3000 (IWV) index.
Let’s look at some stats.
In terms of underlying sectors, the R2000 has a very heavy concentration of financials. In fact, 50% of the index is made up of financials and healthcare:
Portfolio123 data, Author Graph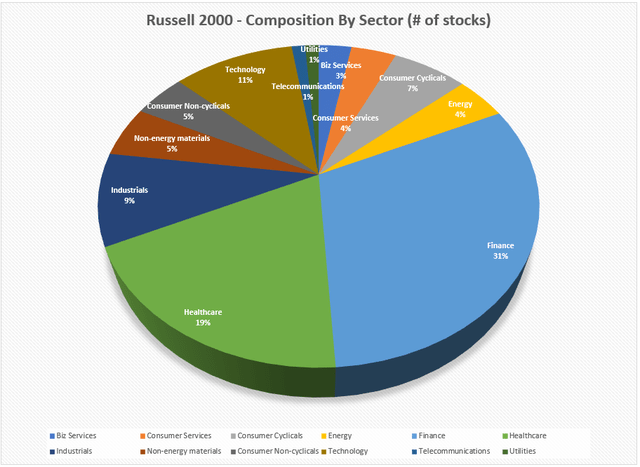
When comparing smallcap performance, it is important to keep this sector make-up in mind. For me personally, I exclude all financials from my strategies, and typically I own few healthcare stocks. In this regard, the R2000 is a poor benchmark to compare against my strategies.
As the R2000 is a “smallcap” index, strictly speaking is does include some larger-sized stocks, as per the table below.
Portfolio123 data, Author Table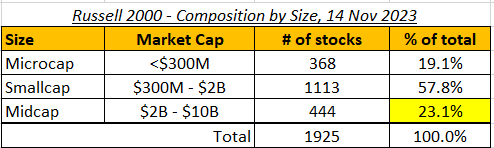
Roughly 75% of the stocks fall within the $2B market cap threshold of smallcaps, but still nearly another 25% of the index is comprised of midcaps.
Another important aspect of the R2000 construction is that it is market-cap weighted, meaning that larger stocks receive a greater weight, or take up a larger proportion of the index and its returns.
If one is investing in smallcaps to exploit the “size” factor (smaller the stock, higher the potential returns), then this feature can be misaligned.
Some other interesting stats of the R2000:
- Roughly 40% of the stocks have declining sales growth in the last year (770 stocks of 1925)
- Roughly 40% of the stocks are not free cash flow positive (791 stocks)
- 20% of stocks have a debt to EBITDA ratio of 5 or more (generally higher than 5 is considered higher risk to credit agencies), compared to 8% and 15% for the Nasdaq and S&P 500 respectively
Broadly speaking, the R2000 could be summed up as
a mostly small cap, market cap weighted index, with a significant number of financial and healthcare stocks, and a high proportion of declining growth, cash flow negative and higher indebted “junk” stocks.
Be that as it may, the R2000 is still considered a benchmark for smallcap stocks.
At the very least, if an investor is informed as to how the benchmark is constructed, they can determine just how comparable their strategy is.
The Russell 2000 “Power Day” – 5.48% in One Day!
With such a strong performance of 5.48% in one day, not seen in nearly one year, some pundits are speculating that the bottom is now in for small and microcaps.
Let’s take a look at strong performance from the Russell 2000 from a historical perspective, and attempt to find potential signals for continued performance to come.
Since 2000, there have been only 29 days when the Russell 2000 has returned 5% or greater in a single day, or “Power Days”. The table below lists all Power Days and the performance.
Investing.com data, Author Table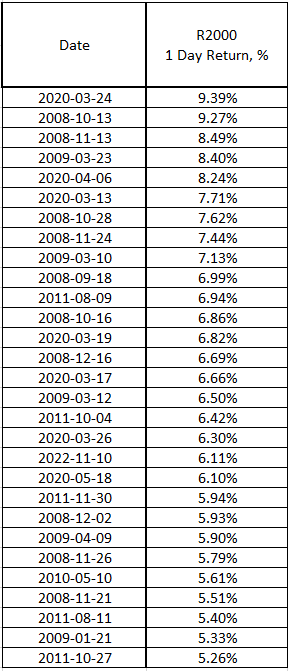
The highest return recorded in a single day was 9.39%, during March 2020 and the COVID crisis.
On average, the Russell 2000 has had a Power Day nearly once per year (1 per 202 trading days). From the table above, many of these days occurred in 2008/2009 and 2020.
The graph below paints a clearer picture of when these Power Days have occurred:
Investing.com data, Author Graph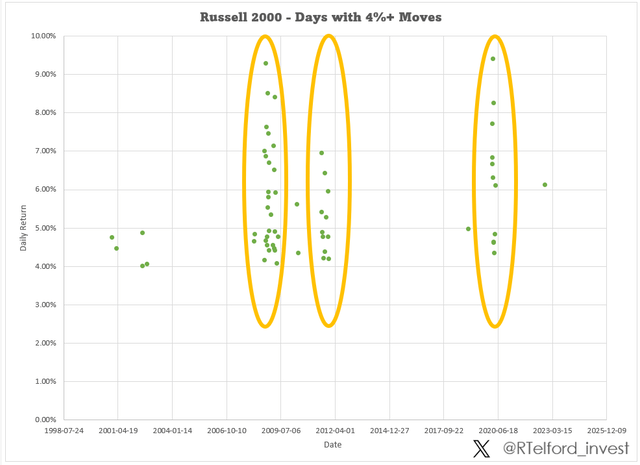
* For clarity – includes 4% days to include more datapoints
These Power Days have historically been very clustered, meaning that high return days tend to occur over relatively short periods, followed by years of no occurrences whatsoever. Since 2000, this clustering has occurred in three periods: 2008/2009 (post GFC), 2011 and 2020 (COVID). Each period was followed by overall high performance of the R2000 (more on this below).
The last Power Day (before yesterday) was roughly a year ago in November of 2022, however this was an outlier with no follow-up Power Days (see graph above).
Power Days and Forward Returns
Is a Power Day in the Russell 2000 predictive of future returns?
The table below lists the various power days since 2000, including R2000 returns for the next 6 months.
Investing.com data, Author Table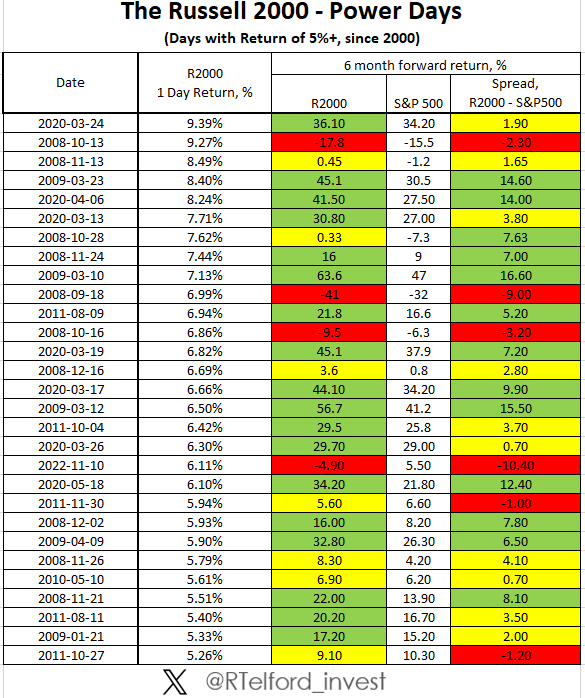
In summary,
- Roughly 60% of R2000 Power Days led to 6-month returns of greater than 10%
- 33% of Power Days resulted in 6-month forward returns of 30% or greater.
- 25% of Power Days with returns of 0-10%
- 15% of Power Days result in negative returns in the next 6 months
Also to note, 6-month performance following Power Days has often outperformed the S&P 500.
These results are encouraging.
14 November 2023 – Power Day #30 (since 2000)
Let’s now look at yesterday’s Power Day, and break down performance of the R2000.
The table below shows median daily returns per sector in the R2000.
Portfolio123 data, Author Table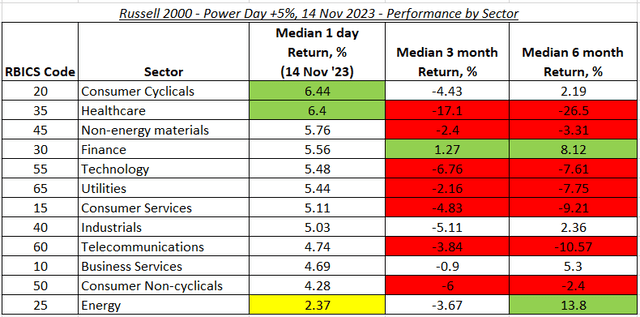
All sectors were positive.
The strongest sectors were consumer cyclicals and healthcare. Notable was the bounce from healthcare, as this sector had the poorest previous 3- and 6-month performance of the various sectors. This is likely also contributing to the overall R2000 return as healthcare makes up nearly 20% of the index (see above).
While still positive, the energy sector scored the lowest median daily return of 2.37%.
Recall that the R2000 is market cap weighted, so greater performance weight is given to those larger stocks. Was the performance driven by the larger stocks?
We can look at the “breadth” of the Power Day by seeing how many stocks participated in the move. From the table below, more than 92% of the R2000 stocks earned a positive return, indicating that the overall index move had participation from the majority of the holdings.
Portfolio123, Author table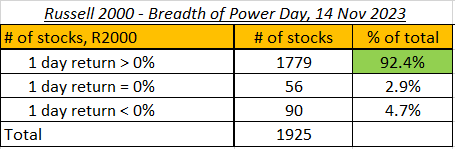
We can also look at how returns were distributed amongst the different size groups:
Portfolio123 data, Author Table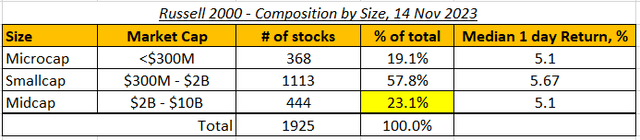
While the benchmark is weighted more towards the larger midcap stocks, the smallcaps held their own, outperforming both micro and midcaps.
And finally by free cash flow (positive/negative), sales growth (positive/negative), and debt/EBITDA (greater or less than 5):
Portfolio123, Author Table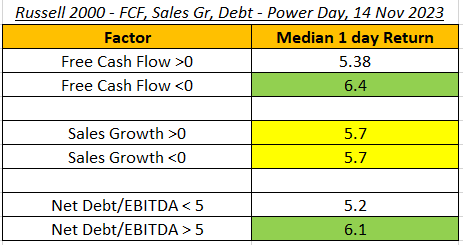
Very interesting in this case, those stocks with negative free cash flow outperformed those with positive free cash flow. On a similar note, those more heavily indebted relative to their earnings outperformed those with less debt.
This last point is in line with the observation that “junk” (or riskier and more speculative stocks) usually gets bid up faster than safety in a sudden “risk-on” market sentiment change.
This “junk” factor is very evident when looking at the top performing stocks of the day.
ISPR, THRX, TPIC, ACIC, SKYX, BW, CUTR, PCT, VEL, VUZI, SWIM, EP, LYEL, TMCI, AMRC
Portfolio123 data, Author Table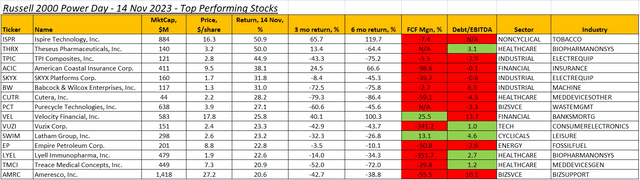
Note that of the top 15 performing stocks, only 2 of the 15 have positive free cash flow. When measuring indebtedness, only 5 stocks are in the safe zone of Debt/EBITDA of less than 5, and several are negative as they are not yet profitable, as measured by EBITDA.
Of course, we are looking at only 2 factors, there are several others one can use to classify a stock as quality or junk. In fact, stay tuned for a future piece on the Quality-Minus-Junk strategy, or QMJ.
Conclusion
Yesterday (14 Nov 2023) marked the 30th “Power Day” for the Russell 2000 since 2000, returning more than 5% in a single day. Some market experts are claiming that this move marks the bottom of the small and microcap bear market.
Does history provide any clues as to whether this is a good sign for the future of small caps? We’ve seen how these power days tend to cluster and have historically resulted in a good chance of future outperformance.
Yesterday’s Power Day showed good breadth of the R2000 index, with more than 92% of stocks providing a positive return. Consumer cyclicals and healthcare showed the strongest performance, with energy lagging the sectors.
Also interestingly, we saw how “junk” had slightly outperformed higher quality stocks.
Is this the bottom for smallcaps? It may be too early to tell, but I am certainly optimistic.
Editor’s Note: This article covers one or more microcap stocks. Please be aware of the risks associated with these stocks.
Read the full article here