


We have been asked for income generation plays specifically as a place to park the trading gains we have made at our investing group over the last few months. We have looked into many single stock income names in the telecom space, the financials, energy, and in real estate. But one exchange-traded fund, or ETF, has consistently looked good, and when the market allows, you should strongly consider an allocation to the JPMorgan Equity Premium Income ETF (NYSEARCA:JEPI).
The full title of the ETF is a bit of a mouthful, so we will refer to it simply by its ticker moniker in “JEPI” going forward. There are a lot of opinions regarding this instrument, but this is the first time we are discussing it with the public, outside of our service. We think it is a winner.
Now just because it is a winner, does not always mean dive in and buy at any price. Let the market give you the opportunity to get the best cost basis that you can. The distribution does fluctuate, so it is tough to plan for regular recurring income on an exact figure, versus more predictable single stock income names, but we like the structure and its income history. The ETF does pull back now and again, and that is when you should buy. In our opinion, it is a fine buy now at $54, but would be loading more heavily the closer the ETF trades to $50. When suggesting an income name for our traders, we are looking for reliable income, which JEPI checks the box on at least in terms of its record of providing payouts, and for a relatively stable trading range, should you need to liquidate for whatever reason.
Folks, it’s hard to argue with the actual numbers, and when we look at the JEPI track record here, and that we expect that record to continue, we think it is a fine buy.
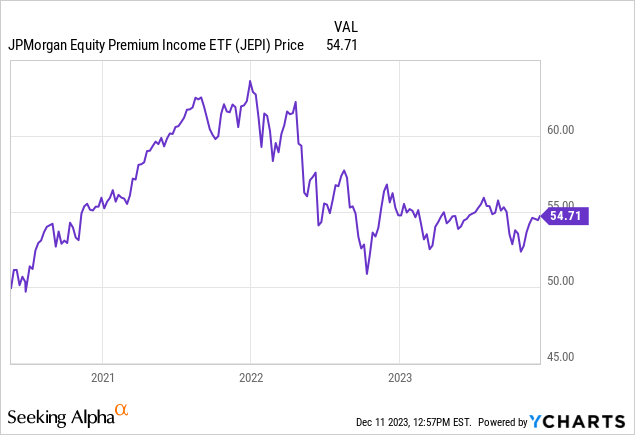
Since inception, the ETF has averaged around a $56 price tag, with select drops into the low $50’s, and a during market peaks of 2021 into early 2022, trading above $60.
The fear here, and this is common to many high income producing names, is that the price will continue to wither over time in exchange for the income being received. But the approach JEPI takes in our opinion limits this risk longer term. Yes, there will be sensitivity to the broader market to a degree, but for the strong 9% yield here that is paid out monthly, the trading range is reasonable.
We have looked into other big income-producing actively managed ETFs that often employ a covered call strategy to increase the amount of income that gets distributed to its investors. But that often comes with hits to the fund with moves in the underlying holdings. Mileage will vary as they say, but we fancy the approach that JEPI takes by segmenting off its call options within the portfolio, and by selling calls that are out of the money. The structure is that about 80% of its assets are in equities, while the other 20% or so is allocated toward generating income through equity-linked notes. For those that may not be familiar with this ticker, or may not be familiar with how these operate, these are structured instruments that sort of combine the features of both fixed-income securities and equities.
Generally speaking, they provide the potential for higher returns linked to the performance of an underlying equity or equity index, while still offering some regular income through coupon payments. You can read more about them here. Now here is where it gets interesting. So, rather than just writing covered call option against the actual equity positions, JEPI also generates income flow from the premiums on the call options that the linked notes write. Unlike other covered call ETFs, the 80% equity portion of JEPI’s portfolio is uncapped, so it should move up (or down) with the market. Here is the complete set of holdings.
| Ticker | Security Description | Security Type | Method | Shares/Par | Market Value [USD] | % of Market Value | % of Net Assets |
| JPMORGAN US GOVT MMKT FUN | MONEY MARKET | Physical | 583358070 | $ 583,358,070.68 | 1.93% | 1.92% | |
| MSFT | MICROSOFT CORP COMMON | DOMESTIC COMMON STOCK | Physical | 1368224 | $ 512,030,467.52 | 1.69% | 1.69% |
| AMZN | AMAZON.COM INC COMMON | DOMESTIC COMMON STOCK | Physical | 3436382 | $ 506,591,434.44 | 1.67% | 1.67% |
| ADBE | ADOBE INC COMMON STOCK | DOMESTIC COMMON STOCK | Physical | 826267 | $ 504,031,132.67 | 1.67% | 1.66% |
| PGR | PROGRESSIVE CORP/THE | DOMESTIC COMMON STOCK | Physical | 3019521 | $ 486,656,199.57 | 1.61% | 1.6% |
| TT | TRANE TECHNOLOGIES PLC | DOMESTIC COMMON STOCK | Physical | 2039022 | $ 477,131,148.00 | 1.58% | 1.57% |
| INTU | INTUIT INC COMMON STOCK | DOMESTIC COMMON STOCK | Physical | 811390 | $ 465,656,721.00 | 1.54% | 1.54% |
| MA | MASTERCARD INC COMMON | DOMESTIC COMMON STOCK | Physical | 1119852 | $ 461,558,200.32 | 1.53% | 1.52% |
| ACN | ACCENTURE PLC COMMON | DOMESTIC COMMON STOCK | Physical | 1349018 | $ 454,929,340.14 | 1.5% | 1.5% |
| V | VISA INC COMMON STOCK | DOMESTIC COMMON STOCK | Physical | 1752274 | $ 448,126,552.76 | 1.48% | 1.48% |
| UNH | UNITEDHEALTH GROUP INC | DOMESTIC COMMON STOCK | Physical | 798403 | $ 438,938,017.31 | 1.45% | 1.45% |
| ABBV | ABBVIE INC COMMON STOCK | DOMESTIC COMMON STOCK | Physical | 2838043 | $ 423,663,059.04 | 1.4% | 1.4% |
| CMG | CHIPOTLE MEXICAN GRILL | DOMESTIC COMMON STOCK | Physical | 178385 | $ 400,108,635.75 | 1.32% | 1.32% |
| CMCSA | COMCAST CORP COMMON | DOMESTIC COMMON STOCK | Physical | 9490952 | $ 399,569,079.20 | 1.32% | 1.32% |
| MDLZ | MONDELEZ INTERNATIONAL | DOMESTIC COMMON STOCK | Physical | 5616028 | $ 399,243,430.52 | 1.32% | 1.32% |
| PEG | PUBLIC SERVICE | DOMESTIC COMMON STOCK | Physical | 6379112 | $ 399,141,037.84 | 1.32% | 1.32% |
| META | META PLATFORMS INC | DOMESTIC COMMON STOCK | Physical | 1189839 | $ 395,918,927.25 | 1.31% | 1.31% |
| NXPI | NXP SEMICONDUCTORS NV | DOMESTIC COMMON STOCK | Physical | 1833392 | $ 395,187,645.60 | 1.31% | 1.3% |
| COST | COSTCO WHOLESALE CORP | DOMESTIC COMMON STOCK | Physical | 644790 | $ 393,824,836.20 | 1.3% | 1.3% |
| CME | CME GROUP INC COMMON | DOMESTIC COMMON STOCK | Physical | 1842703 | $ 389,952,808.86 | 1.29% | 1.29% |
| YUM | YUM BRANDS INC COMMON | DOMESTIC COMMON STOCK | Physical | 3129773 | $ 389,155,974.82 | 1.29% | 1.28% |
| PEP | PEPSICO INC COMMON STOCK | DOMESTIC COMMON STOCK | Physical | 2307217 | $ 382,259,712.56 | 1.26% | 1.26% |
| HON | HONEYWELL INTERNATIONAL | DOMESTIC COMMON STOCK | Physical | 1932513 | $ 376,086,354.93 | 1.24% | 1.24% |
| ETN | EATON CORP PLC COMMON | DOMESTIC COMMON STOCK | Physical | 1594736 | $ 370,473,120.16 | 1.22% | 1.22% |
| LLY | ELI LILLY & CO COMMON | DOMESTIC COMMON STOCK | Physical | 616307 | $ 368,582,401.35 | 1.22% | 1.22% |
| LIN | LINDE PLC COMMON STOCK | DOMESTIC COMMON STOCK | Physical | 915459 | $ 367,346,232.93 | 1.21% | 1.21% |
| LOW | LOWE’S COS INC COMMON | DOMESTIC COMMON STOCK | Physical | 1759077 | $ 365,588,972.91 | 1.21% | 1.21% |
| GOOGL | ALPHABET INC COMMON | DOMESTIC COMMON STOCK | Physical | 2690648 | $ 363,210,573.52 | 1.2% | 1.2% |
| TRV | TRAVELERS COS INC/THE | DOMESTIC COMMON STOCK | Physical | 2003119 | $ 363,085,349.94 | 1.2% | 1.2% |
| VRTX | VERTEX PHARMACEUTICALS | DOMESTIC COMMON STOCK | Physical | 1007864 | $ 352,903,579.60 | 1.17% | 1.16% |
| APD | AIR PRODUCTS AND | DOMESTIC COMMON STOCK | Physical | 1316207 | $ 346,517,816.89 | 1.15% | 1.14% |
| TXN | TEXAS INSTRUMENTS INC | DOMESTIC COMMON STOCK | Physical | 2161679 | $ 339,448,453.37 | 1.12% | 1.12% |
| UPS | UNITED PARCEL SERVICE | DOMESTIC COMMON STOCK | Physical | 2154258 | $ 336,710,525.40 | 1.11% | 1.11% |
| PG | PROCTER & GAMBLE CO/THE | DOMESTIC COMMON STOCK | Physical | 2239705 | $ 325,093,180.75 | 1.07% | 1.07% |
| BMY | BRISTOL-MYERS SQUIBB CO | DOMESTIC COMMON STOCK | Physical | 6408866 | $ 322,430,048.46 | 1.07% | 1.06% |
| ADI | ANALOG DEVICES INC | DOMESTIC COMMON STOCK | Physical | 1715717 | $ 317,201,758.96 | 1.05% | 1.05% |
| KO | COCA-COLA CO/THE COMMON | DOMESTIC COMMON STOCK | Physical | 5241289 | $ 307,191,948.29 | 1.02% | 1.01% |
| REGN | REGENERON | DOMESTIC COMMON STOCK | Physical | 359919 | $ 302,382,348.66 | 1.0% | 1.0% |
| SO | SOUTHERN CO/THE COMMON | DOMESTIC COMMON STOCK | Physical | 4137527 | $ 295,833,180.50 | 0.98% | 0.98% |
| SPX_10 | Equity Linked Notes | Synthetic | 63772 | $ 289,355,246.48 | 0.96% | 0.95% | |
| SPX_12 | Equity Linked Notes | Synthetic | 63644 | $ 288,512,253.68 | 0.95% | 0.95% | |
| SPX_11 | Equity Linked Notes | Synthetic | 63902 | $ 287,776,905.82 | 0.95% | 0.95% | |
| SPX_13 | Equity Linked Notes | Synthetic | 63667 | $ 287,310,707.57 | 0.95% | 0.95% | |
| SPX_14 | Equity Linked Notes | Synthetic | 63728 | $ 287,294,745.92 | 0.95% | 0.95% | |
| SPX_9 | Equity Linked Notes | Synthetic | 64326 | $ 285,114,059.58 | 0.94% | 0.94% | |
| SPX_18 | Equity Linked Notes | Synthetic | 62151 | $ 284,725,539.69 | 0.94% | 0.94% | |
| SPX_15 | Equity Linked Notes | Synthetic | 62393 | $ 284,605,669.50 | 0.94% | 0.94% | |
| SPX_16 | Equity Linked Notes | Synthetic | 62366 | $ 284,229,303.04 | 0.94% | 0.94% | |
| SPX_17 | Equity Linked Notes | Synthetic | 62402 | $ 283,648,291.00 | 0.94% | 0.94% | |
| PLD | PROLOGIS INC REIT USD | REIT | Physical | 2357414 | $ 282,536,067.90 | 0.93% | 0.93% |
| SPX_8 | Equity Linked Notes | Synthetic | 63293 | $ 281,135,480.33 | 0.93% | 0.93% | |
| SPX_7 | Equity Linked Notes | Synthetic | 63393 | $ 279,559,960.35 | 0.92% | 0.92% | |
| SBAC | SBA COMMUNICATIONS CORP | REIT | Physical | 1134729 | $ 277,078,127.22 | 0.92% | 0.91% |
| CTSH | COGNIZANT TECHNOLOGY | DOMESTIC COMMON STOCK | Physical | 3800571 | $ 267,294,158.43 | 0.88% | 0.88% |
| EQIX | EQUINIX INC REIT USD | REIT | Physical | 331998 | $ 266,186,036.46 | 0.88% | 0.88% |
| COP | CONOCOPHILLIPS COMMON | DOMESTIC COMMON STOCK | Physical | 2305980 | $ 258,431,178.60 | 0.85% | 0.85% |
| XOM | EXXON MOBIL CORP COMMON | DOMESTIC COMMON STOCK | Physical | 2460832 | $ 244,975,825.60 | 0.81% | 0.81% |
| SPX_5 | Equity Linked Notes | Synthetic | 62973 | $ 241,644,403.71 | 0.8% | 0.8% | |
| SPX_4 | Equity Linked Notes | Synthetic | 63037 | $ 239,655,327.34 | 0.79% | 0.79% | |
| CL | COLGATE-PALMOLIVE CO | DOMESTIC COMMON STOCK | Physical | 3104203 | $ 239,551,345.51 | 0.79% | 0.79% |
| NEE | NEXTERA ENERGY INC | DOMESTIC COMMON STOCK | Physical | 3936251 | $ 234,994,184.70 | 0.78% | 0.77% |
| OTIS | OTIS WORLDWIDE CORP | DOMESTIC COMMON STOCK | Physical | 2684432 | $ 234,887,800.00 | 0.78% | 0.77% |
| WMT | WALMART INC COMMON STOCK | DOMESTIC COMMON STOCK | Physical | 1539187 | $ 232,201,750.82 | 0.77% | 0.77% |
| SPX_6 | Equity Linked Notes | Synthetic | 63487 | $ 231,572,006.85 | 0.77% | 0.76% | |
| ODFL | OLD DOMINION FREIGHT | DOMESTIC COMMON STOCK | Physical | 623261 | $ 230,263,776.45 | 0.76% | 0.76% |
| HSY | HERSHEY CO/THE COMMON | DOMESTIC COMMON STOCK | Physical | 1221448 | $ 226,871,751.52 | 0.75% | 0.75% |
| DOV | DOVER CORP COMMON STOCK | DOMESTIC COMMON STOCK | Physical | 1570144 | $ 225,504,081.28 | 0.75% | 0.74% |
| NOW | SERVICENOW INC COMMON | DOMESTIC COMMON STOCK | Physical | 318976 | $ 222,989,742.08 | 0.74% | 0.74% |
| FLT | FLEETCOR TECHNOLOGIES | DOMESTIC COMMON STOCK | Physical | 844235 | $ 216,200,141.15 | 0.71% | 0.71% |
| BRK.B | BERKSHIRE HATHAWAY INC | DOMESTIC COMMON STOCK | Physical | 582843 | $ 205,790,206.44 | 0.68% | 0.68% |
| NSC | NORFOLK SOUTHERN CORP | DOMESTIC COMMON STOCK | Physical | 919170 | $ 203,136,570.00 | 0.67% | 0.67% |
| KMB | KIMBERLY-CLARK CORP | DOMESTIC COMMON STOCK | Physical | 1692801 | $ 203,034,551.94 | 0.67% | 0.67% |
| SPGI | S&P GLOBAL INC COMMON | DOMESTIC COMMON STOCK | Physical | 487466 | $ 202,483,627.08 | 0.67% | 0.67% |
| CHD | CHURCH & DWIGHT CO INC | DOMESTIC COMMON STOCK | Physical | 2177792 | $ 202,403,988.48 | 0.67% | 0.67% |
| TMO | THERMO FISHER SCIENTIFIC | DOMESTIC COMMON STOCK | Physical | 400747 | $ 196,273,858.19 | 0.65% | 0.65% |
| EOG | EOG RESOURCES INC COMMON | DOMESTIC COMMON STOCK | Physical | 1648823 | $ 196,143,984.08 | 0.65% | 0.65% |
| DE | DEERE & CO COMMON STOCK | DOMESTIC COMMON STOCK | Physical | 531443 | $ 193,269,875.81 | 0.64% | 0.64% |
| CSX | CSX CORP COMMON STOCK | DOMESTIC COMMON STOCK | Physical | 5685394 | $ 187,390,586.24 | 0.62% | 0.62% |
| ASML | ASML HOLDING NV NY REG | ADR | Physical | 266340 | $ 185,487,166.20 | 0.61% | 0.61% |
| BKNG | BOOKING HOLDINGS INC | DOMESTIC COMMON STOCK | Physical | 55728 | $ 182,509,200.00 | 0.6% | 0.6% |
| USB | US BANCORP COMMON STOCK | DOMESTIC COMMON STOCK | Physical | 4473259 | $ 180,853,861.37 | 0.6% | 0.6% |
| JKHY | JACK HENRY & ASSOCIATES | DOMESTIC COMMON STOCK | Physical | 1063414 | $ 175,133,651.66 | 0.58% | 0.58% |
| CB | CHUBB LTD COMMON STOCK | DOMESTIC COMMON STOCK | Physical | 781052 | $ 174,104,301.32 | 0.58% | 0.57% |
| KEYS | KEYSIGHT TECHNOLOGIES | DOMESTIC COMMON STOCK | Physical | 1186747 | $ 171,283,194.51 | 0.57% | 0.56% |
| ICE | INTERCONTINENTAL | DOMESTIC COMMON STOCK | Physical | 1422130 | $ 161,184,214.20 | 0.53% | 0.53% |
| TJX | TJX COS INC/THE COMMON | DOMESTIC COMMON STOCK | Physical | 1807237 | $ 161,079,033.81 | 0.53% | 0.53% |
| MRK | MERCK & CO INC COMMON | DOMESTIC COMMON STOCK | Physical | 1534859 | $ 159,241,621.25 | 0.53% | 0.53% |
| RTX | RTX CORP | DOMESTIC COMMON STOCK | Physical | 1913818 | $ 155,631,679.76 | 0.51% | 0.51% |
| ELV | ELEVANCE HEALTH INC | DOMESTIC COMMON STOCK | Physical | 317739 | $ 151,869,709.83 | 0.5% | 0.5% |
| HUM | HUMANA INC COMMON STOCK | DOMESTIC COMMON STOCK | Physical | 314029 | $ 151,242,646.98 | 0.5% | 0.5% |
| TXT | TEXTRON INC COMMON STOCK | DOMESTIC COMMON STOCK | Physical | 1982675 | $ 150,544,512.75 | 0.5% | 0.5% |
| AZO | AUTOZONE INC COMMON | DOMESTIC COMMON STOCK | Physical | 56999 | $ 149,365,309.51 | 0.49% | 0.49% |
| CDNS | CADENCE DESIGN SYSTEMS | DOMESTIC COMMON STOCK | Physical | 560545 | $ 145,702,461.85 | 0.48% | 0.48% |
| SNPS | SYNOPSYS INC COMMON | DOMESTIC COMMON STOCK | Physical | 267577 | $ 143,402,541.61 | 0.47% | 0.47% |
| MDT | MEDTRONIC PLC COMMON | DOMESTIC COMMON STOCK | Physical | 1765261 | $ 140,073,460.35 | 0.46% | 0.46% |
| BSX | BOSTON SCIENTIFIC CORP | DOMESTIC COMMON STOCK | Physical | 2457739 | $ 135,052,758.05 | 0.45% | 0.45% |
| DHR | DANAHER CORP COMMON | DOMESTIC COMMON STOCK | Physical | 617544 | $ 134,309,644.56 | 0.44% | 0.44% |
| AXP | AMERICAN EXPRESS CO | DOMESTIC COMMON STOCK | Physical | 787855 | $ 132,698,417.65 | 0.44% | 0.44% |
| JNJ | JOHNSON & COMMON | DOMESTIC COMMON STOCK | Physical | 854131 | $ 131,894,909.02 | 0.44% | 0.43% |
| FDX | FEDEX CORP COMMON STOCK | DOMESTIC COMMON STOCK | Physical | 469497 | $ 127,801,778.37 | 0.42% | 0.42% |
| CMS | CMS ENERGY CORP COMMON | DOMESTIC COMMON STOCK | Physical | 2122647 | $ 123,431,923.05 | 0.41% | 0.41% |
| AEE | AMEREN CORP COMMON STOCK | DOMESTIC COMMON STOCK | Physical | 1438211 | $ 112,209,222.22 | 0.37% | 0.37% |
| UNP | UNION PACIFIC CORP | DOMESTIC COMMON STOCK | Physical | 418098 | $ 96,066,377.46 | 0.32% | 0.32% |
| DOW | DOW INC COMMON STOCK USD | DOMESTIC COMMON STOCK | Physical | 1859400 | $ 94,680,648.00 | 0.31% | 0.31% |
| MNST | MONSTER BEVERAGE CORP | DOMESTIC COMMON STOCK | Physical | 1664317 | $ 89,739,972.64 | 0.3% | 0.3% |
| GD | GENERAL DYNAMICS CORP | DOMESTIC COMMON STOCK | Physical | 353059 | $ 89,073,255.11 | 0.29% | 0.29% |
| LYB | LYONDELLBASELL | DOMESTIC COMMON STOCK | Physical | 956345 | $ 88,538,420.10 | 0.29% | 0.29% |
| PCG | PG&E CORP COMMON STOCK | DOMESTIC COMMON STOCK | Physical | 4982096 | $ 87,734,710.56 | 0.29% | 0.29% |
| CHTR | CHARTER COMMUNICATIONS | DOMESTIC COMMON STOCK | Physical | 200065 | $ 73,533,890.75 | 0.24% | 0.24% |
| PM | PHILIP MORRIS | DOMESTIC COMMON STOCK | Physical | 802732 | $ 73,297,458.92 | 0.24% | 0.24% |
| CNC | CENTENE CORP COMMON | DOMESTIC COMMON STOCK | Physical | 928481 | $ 68,494,043.37 | 0.23% | 0.23% |
| TGT | TARGET CORP COMMON STOCK | DOMESTIC COMMON STOCK | Physical | 496171 | $ 67,077,357.49 | 0.22% | 0.22% |
| MSI | MOTOROLA SOLUTIONS INC | DOMESTIC COMMON STOCK | Physical | 184569 | $ 59,896,331.88 | 0.2% | 0.2% |
| CVX | CHEVRON CORP COMMON | DOMESTIC COMMON STOCK | Physical | 408788 | $ 58,992,196.28 | 0.19% | 0.19% |
| AAPL | APPLE INC COMMON STOCK | DOMESTIC COMMON STOCK | Physical | 294823 | $ 57,699,809.33 | 0.19% | 0.19% |
| VRSN | VERISIGN INC COMMON | DOMESTIC COMMON STOCK | Physical | 262630 | $ 55,932,311.10 | 0.18% | 0.18% |
| BBY | BEST BUY CO INC COMMON | DOMESTIC COMMON STOCK | Physical | 661522 | $ 48,946,012.78 | 0.16% | 0.16% |
| KVUE | KENVUE INC COMMON STOCK | DOMESTIC COMMON STOCK | Physical | 2371021 | $ 48,866,742.81 | 0.16% | 0.16% |
| UDR | UDR INC REIT USD 0.01 | REIT | Physical | 1374445 | $ 48,614,119.65 | 0.16% | 0.16% |
| GL | GLOBE LIFE INC COMMON | DOMESTIC COMMON STOCK | Physical | 354297 | $ 43,351,780.92 | 0.14% | 0.14% |
| MO | ALTRIA GROUP INC COMMON | DOMESTIC COMMON STOCK | Physical | 982355 | $ 40,571,261.50 | 0.13% | 0.13% |
| D | DOMINION ENERGY INC | DOMESTIC COMMON STOCK | Physical | 677603 | $ 32,179,366.47 | 0.11% | 0.11% |
| BIIB | BIOGEN INC COMMON STOCK | DOMESTIC COMMON STOCK | Physical | 128842 | $ 30,830,602.18 | 0.1% | 0.1% |
| AMT | AMERICAN TOWER CORP REIT | REIT | Physical | 149284 | $ 30,819,681.80 | 0.1% | 0.1% |
| STX | SEAGATE TECHNOLOGY | DOMESTIC COMMON STOCK | Physical | 364817 | $ 29,400,602.03 | 0.1% | 0.1% |
| ADSK | AUTODESK INC COMMON | DOMESTIC COMMON STOCK | Physical | 117057 | $ 26,221,938.57 | 0.09% | 0.09% |
| ORLY | O’REILLY AUTOMOTIVE INC | DOMESTIC COMMON STOCK | Physical | 27390 | $ 25,907,653.20 | 0.09% | 0.09% |
| GWW | WW GRAINGER INC COMMON | DOMESTIC COMMON STOCK | Physical | 32193 | $ 25,884,781.65 | 0.09% | 0.09% |
| BDX | BECTON DICKINSON & CO | DOMESTIC COMMON STOCK | Physical | 107529 | $ 24,978,986.70 | 0.08% | 0.08% |
| EQR | EQUITY RESIDENTIAL REIT | REIT | Physical | 314647 | $ 18,507,536.54 | 0.06% | 0.06% |
| BURL | BURLINGTON STORES INC | DOMESTIC COMMON STOCK | Physical | 99087 | $ 17,467,056.36 | 0.06% | 0.06% |
| VLTO | VERALTO CORP | DOMESTIC COMMON STOCK | Physical | 224835 | $ 16,959,304.05 | 0.06% | 0.06% |
| SPX_3 | Equity Linked Notes | Synthetic | 0 | $ 0.00 | 0.0% | 0.0% | |
| CASH OR CASH COLLATERAL | CASH OR CASH COLLATERAL | Physical | -60025611 | -$ 60,025,611.90 | 0.04% | 0.04% |
Now, here is another point we want to make. Notice on the chart the value of the ETF was in the $60s when the market ran. The market is running again, but the ETF value now has not kept pace. The 80% of the fund in equities should run commensurate with market, with high correlation.
Of course, the NASDAQ (COMP.IND) and the S&P 500 (SP500) still have a ways go to get back to all-time highs, but with a perfect correlation we would expect JEPI would have been priced closer to $58 to $59 here. But that said, with the massive income here, if you wait long enough, your entire initial investment can be recouped income, and then everything on top of that is gravy. That is a very attractive point here. Unlike a single stock which can go bust, JEPI is a basket of holdings, and will never go belly up. If it did, that means we would have a much bigger market problem on our hands. So far, the ETF has paid nearly $18 in distributions, and the ETF is up nearly 10%. These are pretty solid total returns.
Of course, the second concern many have aside from whether the ETF can keep pace with market gains, is if the distributions can continue to be so plentiful. Certainly it is worth noting distributions have fluctuated, but are indeed down from last year:
Seeking Alpha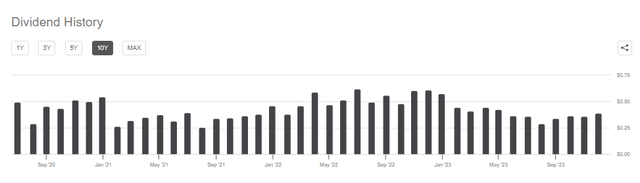
Now that said, the distributions are going to fluctuate based on the equity and option income. One thing we like, at least in terms of downside protection, is that when reviewing the holdings above it is clear that the portfolio quality-oriented, with many lower-beta names versus some of the many other call option selling income ETFs we have looked at. When you are selling covered calls you can lose if the underlying assets run up above the covered call ceiling and get called away. Then the fund has to buy back the stock and sell more calls, or roll them. But, the fund sells out-of-the-money call options, which gives a much better blend of income and “room to move.”
If we look to the distributions having come down, it is well beyond the scope of this column to assess where the call selling or equity linked notes may have underperformed. But as a firm that does a lot of options trading, we would like to remind you of just one fact. When volatility and stock movement is lower, options premiums are cheap. In other words, selling premium is more rewarding in a higher volatility environment. Since volatility has fallen off of a cliff in the last year, it is reasonable to expect less income from covered calls, even in a perfectly executed fashion.
With that said, a 9% yield, with prices that have been trading in a pretty defined range, JPMorgan Equity Premium Income ETF seem is strong contender for a spot in your income holdings. If you are wondering what to do with trading gains, or have capital to put to work, consider JEPI on market dips.
Read the full article here