


The Nuveen Preferred & Income Opportunities Fund (NYSE:JPC) is a CEF which seeks to provide investors with a high current level of income by investing in preferred securities and other high yield securities.
I view the preferred securities market sector as one that investors should have exposure to given current high levels of yield, reasonably strong credit quality, and potential tax benefits compared to bonds.
JPC currently offers an ~8.6% market distribution rate and 7.4% NAV distribution rate. This distribution rate may seem highly attractive given the fairly high credit quality of the fund’s holdings (~80% of holdings are rated BBB or better), but I believe it is less attractive when considering the amount of leverage (currently 38%.)
BBB corporate bonds, which can be proxied by the iShares BBB Rated Corporate Bond ETF (LQDB), tend to offer significantly less yield. LQDB holdings are characterized by an average yield to maturity of 5.3%. Passive preferred stock products such as the Global X U.S. Preferred ETF (PFFD) offer yields of ~6.6%.
JPC is forced to employ significant leverage to generate its distribution, as the spread between its leverage cost and underlying investment yield is fairly small right now. Moreover, JPC also carries a hefty management fee.
These negatives are partially offset by the fund’s significant discount to NAV, which is currently fairly wide relative to historical norms.
High Expense Ratio Is A Negative
JPC charges an annual management fee of 1.31% and has other annual expenses of 0.11%. Thus, the total expense ratio of fund is 1.42% (excluding the cost of leverage.) This fee level is very high compared to other products focused on preferred securities. Comparably, the Global X U.S. Preferred ETF (PFFD) has a total expense ratio of just 0.23% while the Invesco Preferred ETF (PGX) has a total expense ratio of 0.50%. JPC’s fee is also high compared to the average equity and bond mutual fund average fees of 0.44% and 0.37% respectively. Finally, JPC’s fee is also very high compared to other actively managed preferred funds such as the PIMCO Preferred and Capital Securities Active Exchange-Traded Fund (PRFD) which charges a net expense ratio of 0.74%.
To get a sense of just how big of a headwind JPC’s high fee structure is, is it relevant to consider JPC’s fee represents ~19% of the NAV distribution rate of the fund. Additionally, I view JPC’s fee as a difficult hurdle to overcome given the relatively low risk nature of the products it invests in. Historically, banking sector preferred issues have a default rate of ~0.5% while all other sectors have an average default rate of ~2.3%. Given low default rates and relatively high credit quality of portfolio holdings (~80% of holdings rated BBB or better) I believe it will be difficult for JPC to recover its fee in terms of active management.
High Leverage Is A Headwind
JPC’s NAV distribution rate of 7.4% is well above the ~6.6% distribution yield of passive products such as PFFD, which have similar to slightly lower credit quality than JPC. ~64% of PFFD holdings are rated BBB- to BBB+ while ~25% of holdings are rated BB- to BB+.
JPC is able to offer a high distribution rate primarily due to its use of leverage. Currently, JPC has ~38% effective leverage (31.5% regulatory leverage) and the annualized leverage cost is 6.25%.
I view the amount of leverage in the context of the current cost of leverage as a negative. The fact that JPC’s annualized cost of leverage is just 1.15% less than the fund’s NAV distribution rate is troubling, as it suggests the added income generated through the use of leverage is relatively small vs the amount of leverage. For example, consider the fact that JPC requires ~38% effective leverage to generate a distribution rate which is just 12% greater than passive unlevered products of similar credit quality such as PFFD.
I would be more supportive of JPC’s use of high levels of leverage if the cost of leverage were substantially lower such that the amount of additional income generated was more proportional to the amount of leverage employed. While JPC’s cost of leverage appears to be modestly below the yield of its underlying assets, the differential is very small relative to the added risk.
Investors Have Not Historically Been Compensated For Elevated Volatility
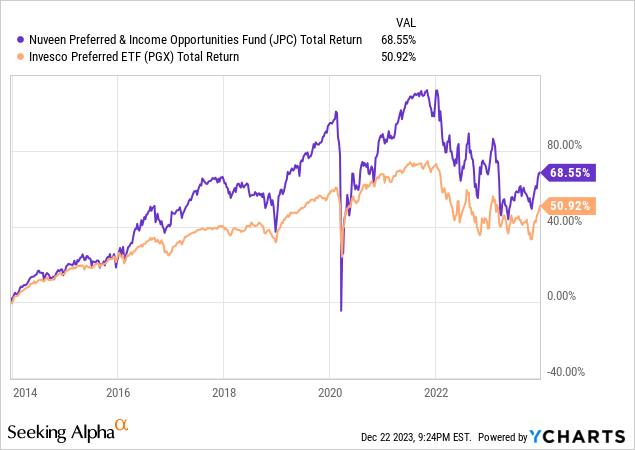
As shown by the chart below, historically, JPC has outperformed passive peer funds such as PGX by a healthy margin. Over the past 10 years, JPC has delivered a total return of 68.6% compared to a total return of 50.9% for PGX.
However, absolute performance alone is not the most appropriate comparison, as JPC is highly leveraged. On a risk adjusted basis, the picture changes considerably.
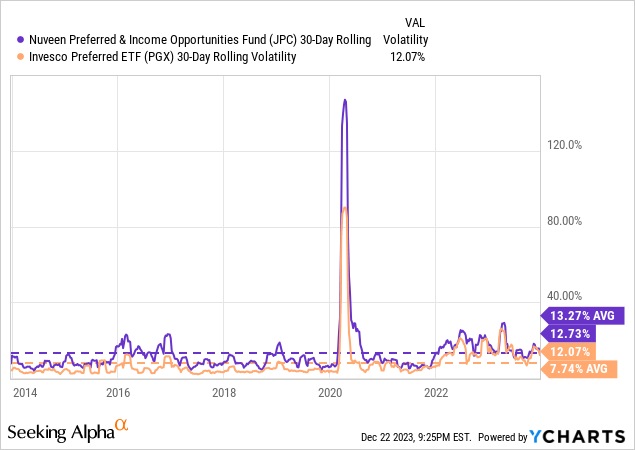
Over the past 10 years, JPC has realized an average 30-day volatility of 13.3%. Comparably, PGX has realized an average 30-day volatility of 7.7%. Thus, JPC has been ~73% more volatile on average.
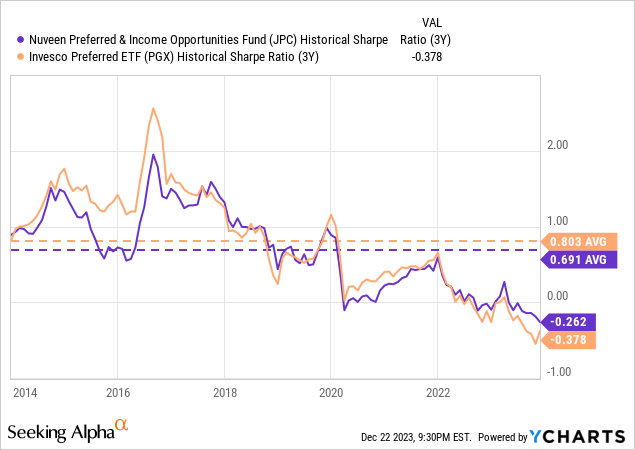
In terms of risk adjusted return, over the past 10 years, JPC has realized an average 3-year trailing sharpe ratio of 0.69. Comparably, PGX has realized an average 3-year trailing sharpe ratio of 0.80 over the same time period.
Based on these metrics, I believe it is clear that JPC investors have not been compensated enough for the added risk related to leverage and CEF structure. I do not expect this to change going forward.
The CEF structure creates an additional source of risk as the fund can trade at substantial discounts to NAV from time to time, which creates another source of volatility.
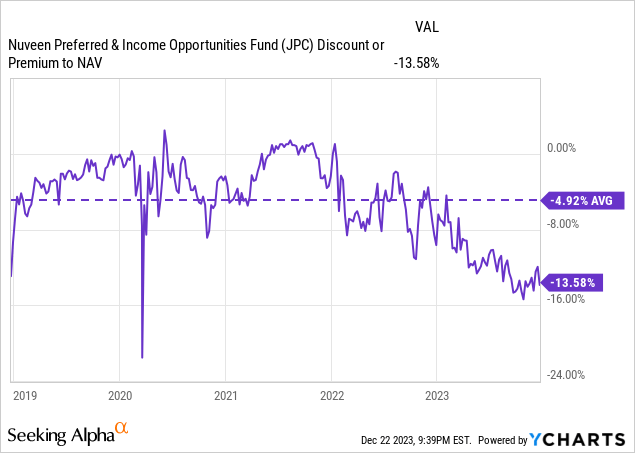
Large Discount to NAV
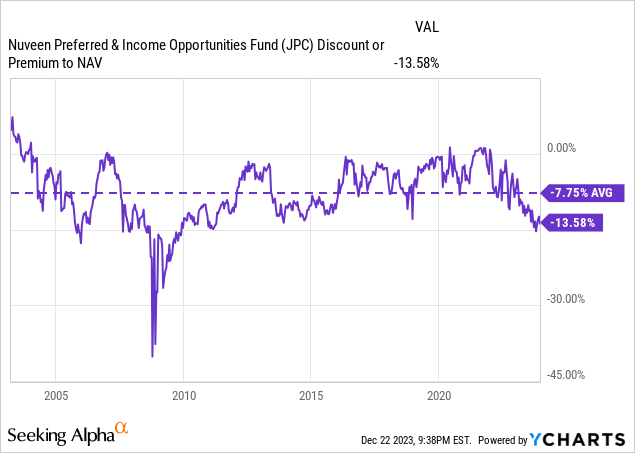
JPC is currently trading at a ~13.5% discount to its NAV. This represents a more significant discount than JPC average discount to NAV of 7.75% since inception. Additionally, the current discount is significantly more than the 4.92% average discount to NAV over the past 5 years.
Furthermore, JPC’s ~13.5% discount to NAV is substantially greater than the average CEF discount of ~9.2%.
JPC’s large discount to NAV also results in a 8.6% market distribution rate, which is substantially higher than the 7.4% NAV distribution rate. The 8.6% distribution rate is ~30.3% greater than the ~6.6% distribution offered by passive peer PFFD. This level of additional yield is noteworthy given the fact that JPC is employing ~38% leverage.
Based on these factors, I believe there is a case to be made that JPC’s discount may be poised to narrow somewhat over the near-term. However, the timing of when such a move may take place is difficult to predict. One potential catalyst could be an activist campaign to push Nuveen to take action, such as repurchasing shares or converting to an open-ended structure to narrow the discount.
Saba Capital Management, a leading alternative asset management firm founded by Boaz Weinstein, has been active in the space and recently won a favorable verdict in a case brought against Nuveen related to shareholder voting rights. While JPC was not part of the case, the verdict opens the door for additional activist campaigns from Saba or others.
While I view a narrowing of the JPC’s discount to NAV as more likely than not, it also must be noted that the potential exists for a substantial widening of the discount. For example, during the 2008-2009 financial crisis, JPC traded at a greater than 30% discount to NAV. During the 2020 covid-19 induced sell-off, JPC traded at a ~20% discount to NAV for a period of time.
Conclusion
JPC currently offers a high level of income with a market distribution rate of 8.6%. However, it must be noted that the fund uses a substantial level of leverage to generate this level of yield.
JPC charges a total expense ratio of 1.42% which is well above both passive and active peers. I view this fee level as a particularly strong headwind given the relatively low default rate in the preferred securities market segment, which creates less opportunity for active managers to win by avoiding defaulting securities.
Historically, investors have not been particularly well compensated for the additional risk that JPC takes vs passive low fee unlevered ETFs. I believe reasons for this include JPC’s high fees (which weigh on total returns), the high cost of leverage at times, and additional volatility related to the fund’s trading levels relative to NAV. I expect these to continue going forward.
Currently, JPC is trading at a very wide discount to NAV relative to historical norms and other CEFs. For this reason, I believe it is more likely than not that the discount may narrow in the near-term. However, I am uncertain as to the timing of such a move. In addition to a benefiting from a potential narrowing of the discount to NAV, JPC investors also benefit via an enhanced 8.6% market distribution level compared to a 7.4% distribution level.
For these reasons, I currently rate JPC a hold and view it as a reasonable alternative for aggressive investors relative to passive low fee products such as PGX and PFFD. The substantial discount to NAV offsets negatives related to the cost of leverage and high fee level.
I would consider downgrading the fund to a sell in the event that the discount to NAV narrows closer to recent historical levels.
Read the full article here