After a 25% gain in 2023 the SPDR® S&P 500 ETF Trust (NYSEARCA:SPY) now faces three major near-term headwinds that combine with extreme valuations to create an exceptionally poor risk-reward outlook. These include an array of bearish divergences across US assets, widespread complacency in options markets, and excessive optimism about Fed rate cuts.
The SPY is the largest and most liquid S&P 500 ETF, with $490bn in assets, slightly ahead of the Vanguard S&P 500 ETF (VOO) while its expense fee is slightly higher at 0.09% vs the VOO’s 0.03%. My last article on the SPY was in early September and despite a 9% decline that shortly followed, an ‘everything rally’ from the October lows has left the market 5% above its September highs. The bearish case is now even more compelling.
Divergences Galore
Unlike the longer term rally in the SPY, the rally from the October lows has been led by lower quality stocks. The Goldman Sachs most shorted index has risen by an impressive 37%, while the median S&P500 stock has risen faster than the Magnificent 7 index, which had previously driven the rally.
Despite this low quality outperformance, the SPY has failed to break to new all-time highs even as the Magnificent 7 index and the Nasdaq 100 have reached new highs. In recent sessions the SPY has sold off after failing to take out the January 2022 peak.
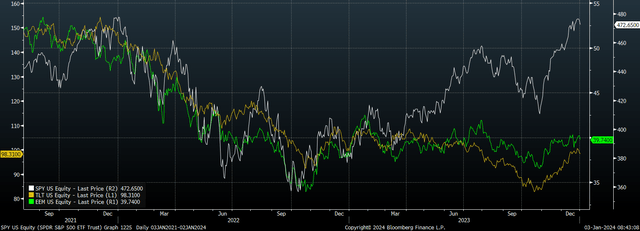
Other divergences can be seen in the behaviour of Treasury bond prices, with the iShares 20 Plus Year Treasury Bond ETF (TLT) having failed to post a higher high despite its strong rally. Meanwhile, emerging market benchmarks have also failed to break above their August highs.

SPY Vs TLT and EEM (Bloomberg)
Complacency Abounds
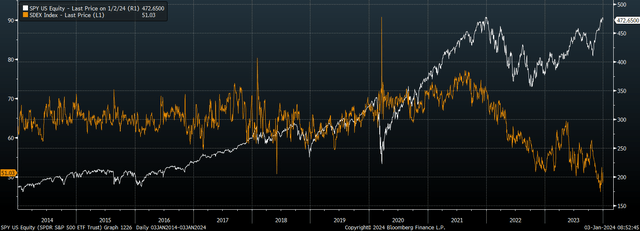
Market complacency is extremely widespread at present, with two key indicators showing that investors have very little fear of large market declines, which should be seen as a contrarian indicator. The first is the SDEX skew index. This index compares the implied volatility of at-the-money SPY puts to out-of-the-money SPY put at one standard deviation (68.3%). This aims to show how expensive OTM (out of the money) options are in relation to ATM (at the money) options. The lower the SDEX, the less fear long only investors have regarding a large correction and the greater the risk that a pick up in implied volatility could cause a deep correction.

SPY Vs SDEX (Bloomberg)
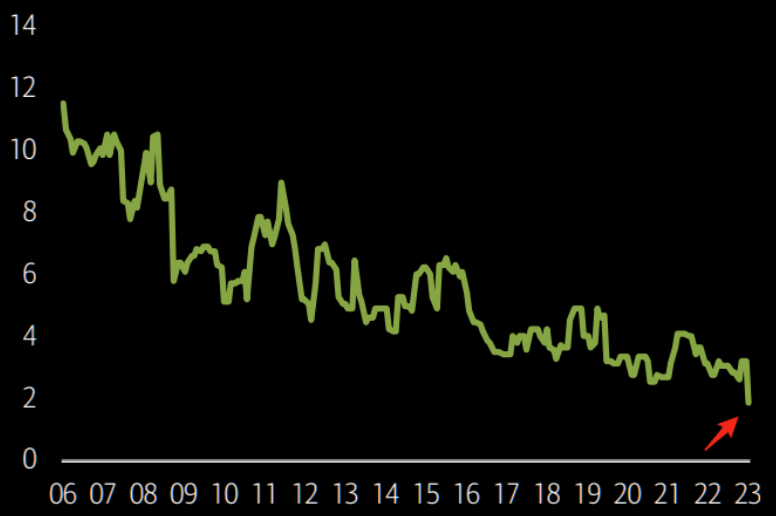
The second refers to Wall Street strategists and their recommended allocations to cash. As the chart from BofA shows based on data going to 2006 cash recommendations have fallen to new all-time lows of around 2%. These two indicators highlight just how little the wall of worry is in the US market right now.

Wall Street Strategist Cash Recommendations, % of Assets (BofA)
Excessive Rate Cut Optimism
The SPY has moved in lockstep with bond prices over recent months, with the 50-day rolling correlation between the SPY and the TLT now at its highest level on record at 0.96%. Optimism over the end of high inflation and the beginning of the easing cycle has fuelled the rally, but there is a growing risk that the bond market has gotten ahead of itself with respect to interest rate cuts. Markets are now pricing in 150bps of cuts, despite the strong tendency for the Fed to only ease rates after stocks and/or corporate bond yields have corrected. Should the Fed remain on hold for longer than expected, we could see the SPY give back much of its recent gains.
Valuations Imply Extremely Weak Long Term Returns
The factors above represent immediate market risks, but they combine with the increasingly negative long-term outlook suggested by valuations. The S&P500 PE ratio has risen back to 23x, while the price-to-free cash flow has risen to 28x. These figures are particularly high when considering that profit margins and free cash flow margins remain higher than any other level outside the 2020-2022 period. Note that it would not necessarily take a fall in margins for US stocks to deliver poor long term returns. Real S&P500 sales have grown by just 1% annually since the pre-global financial crisis peak, and if this trend continues, even continued elevated margins will see the SPY return just 2.4% annually in real terms when adding in the impact of the 1.4% dividend yield.
It is highly unlikely that SPY investors expect such low returns, and this creates a serious risk of a large valuation reduction. If the real required rate of return on the SPY were to rise to just 3%, which is less than half its historical average, this would require a dividend yield of 2% assuming 1% real annual growth. This would require a 30% decline in the SPY.
Read the full article here


