


Stocks continued to rebound yesterday to the extent that the S&P 500 recovered all of last week’s losses and now sits just 0.3% from a new all-time high. The sector leadership so far this year is an unusual mix with healthcare leading the pack, followed by communications services, as growth and value battling for the lead in an overall improving environment for market breadth. While I have been anticipating new all-time highs for some time, I was also expecting a pullback or period of consolidation in advance of that new high as we began the new year. I am not confident that the 2% drawdown over the first four days of trading will do the trick. Therefore, I am reviewing some of the technical indicators I use, both short and long term, to conclude what the potential downside might be from here for the broad market.
Finviz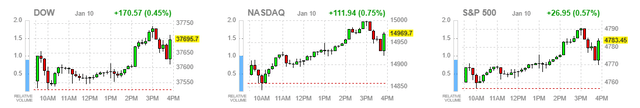
One of my favorite short-term indicators is the percentage of stocks trading above their 50-day moving average for a particular index. With respect to the S&P 500, the percentage tends to peak at 90% and bottom around 30%. There are several extreme cases where the percentage has fallen to single digits, which have clearly been meaningful buying opportunities. After peaking at 91.6% just days ago, we sit at 85.8%, which has hardly resolved the overbought condition that existed in late December. In fact, every time the percentage has risen above 70% over the past three years there has been a subsequent decline to at least 30%. Something like this has happened within just a few weeks.
Stockcharts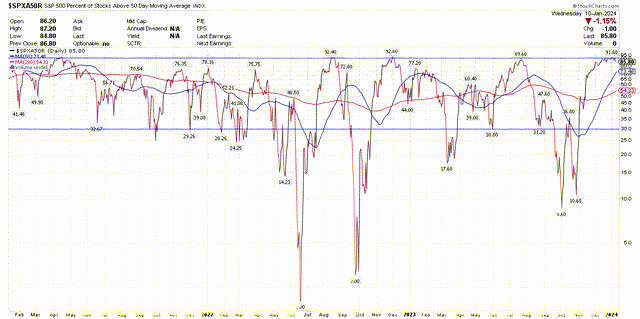
I like to couple this indicator with the percentage of stocks on the New York Stock Exchange (approximately 2,400) that are trading above their 20-day exponential moving average (EMA). In a similar fashion, this indicator peaks close to 90% and bottoms around 20%. It was this indicator that gave me pause last year in both late February and July, as I noted concern that we may see a pullback or period of consolidation in the major market indexes. I was early in calling for an end to the fall correction, as this indicator approached 20% but did not pierce it. That did not happen until early October, but the fact that we remained in a bull market uptrend bailed me out of that early call.
Stockcharts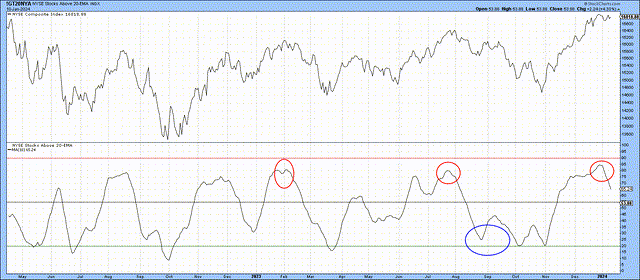
Today, note that we have made some meaningful progress in bringing this percentage down to its mean, but there is further to go at approximately 65% before this indicator screams short-term buying opportunity.
I also follow the New York Stock Exchange High-Low Index, which calculates the percentage of stocks reaching new 52-week highs relative to the total number of new highs plus new lows. It is a breadth indicator that is its most useful at extremes. Its recent high of 93.8% was an extreme, but it has now fallen to 80%. Even if breadth remains strong, a level closer to 60-70% would indicate a healthy pullback.
Stockcharts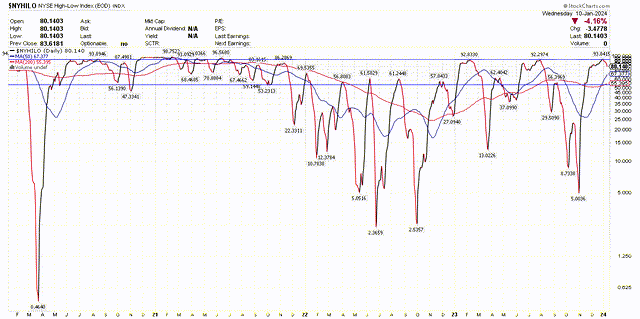
How do these indicators impact the S&P 500? It seems probable that we will see lower levels in the weeks ahead if these short-term technical indicators revert to their means. The Relative Strength Index (RSI) for the S&P 500 resolved its extremely overbought condition from mid-December (top of chart) by the benchmark simply consolidating over the past three weeks. Yet I think we can see a test of the 50-day moving average at approximately 4,600 before we set the stage for another significant advance. That would be a relatively mild 4% drawdown from the recent high. Of course, we could see a larger pullback, depending on the incoming economic data.
Stockcharts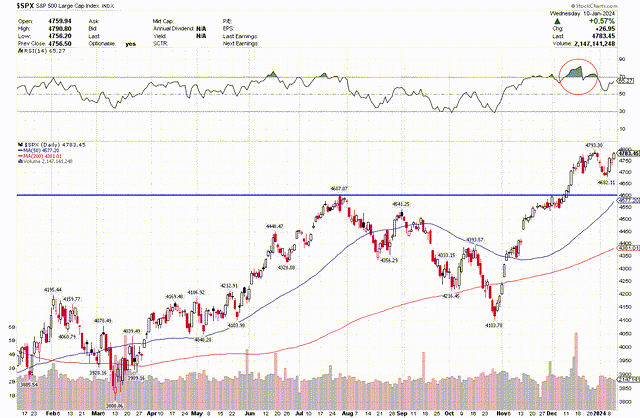
All this said, I remain firmly in the bull camp from a fundamental perspective, which is why the following statistic was music to my ears for the longer term uptrend. Yesterday, Bespoke Investment Group noted that it had been 50 trading days since the correction low last October 27, during which the Russell 2000 index rallied more than 20%. That was only the 21st time such a rally has occurred over a rolling 50-day period since 1979.
Bespoke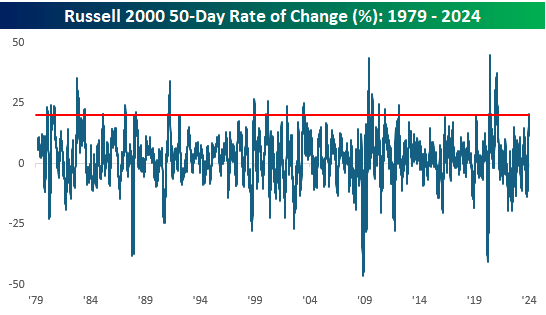
The forward returns after such a large move upward for the index are impressive. In fact, the median gain has outperformed over the following week, month, three-month, six-month, and one-year periods.
Bespoke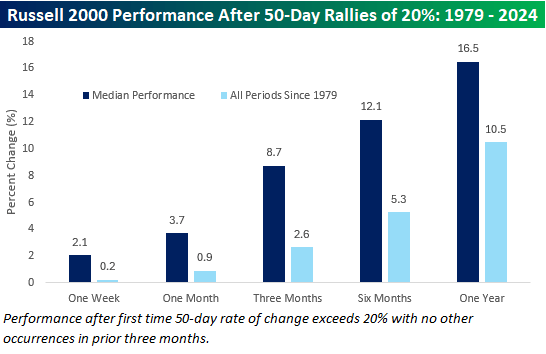
The Russell 2000 index has pulled back 5% from a major breakout that followed a long period of consolidation over the past two years. This index is far from overbought and poised for a move higher, based on the technical. It is far more volatile than the S&P 500 and could see a further decline to its long-term moving average, but I think that would set the stage for a more pronounced advance to a new 52-week high.
Stockcharts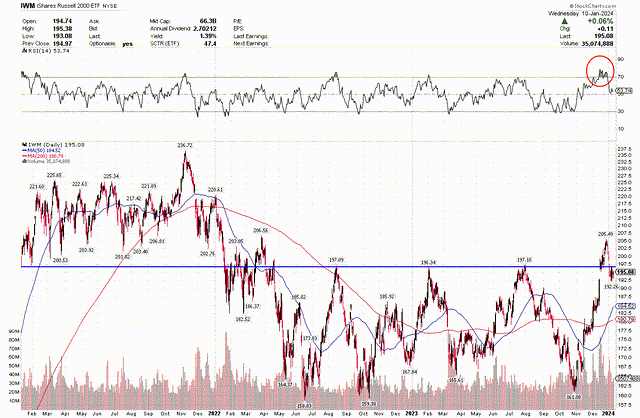
I love to come across statistics like this when they reaffirm my fundamental outlook for the economy (soft landing) and market (bullish). I still need to respect the short-term condition, which remains extended to the upside. That is why I started the year leaning modestly defensive with the hopes of putting dry powder to work on pullback during the early part of this year.
Read the full article here