


Summary
- In 2024, U.S. SMID cap growth stocks were dominated by narrow performance drivers—crowded AI trades and interest rate-sensitive sectors like housing and biotech—with the top ten contributors accounting for more than 1/3 of the Russell 2500 Growth Index (the “Index”) return. This created a challenging environment for most profitable, high-quality companies and highlighted the market’s increasingly short-term focus.
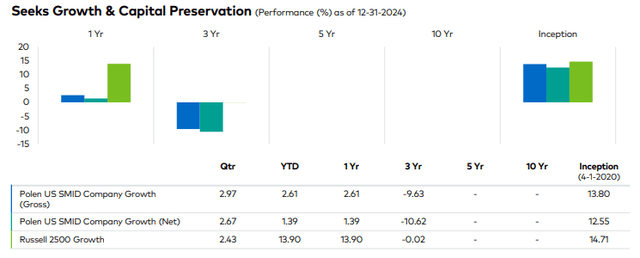
- The U.S. SMID Company Growth Composite Portfolio (the “Portfolio”) delivered 3.0% gross of fees and 2.7% net of fees for the quarter, slightly outperforming the Index. This marked the end of an overall disappointing year in which the Portfolio returned 2.6% gross of fees and 1.4% net of fees, underperforming the Index’s 13.9% return.
- The top contributors to the Portfolio’s relative and absolute performance in the fourth quarter were Revolve Group (RVLV), Warby Parker (WRBY), and Goosehead Insurance (GSHD).
- The most significant detractors from relative performance were Booz Allen Hamilton (BAH), TopBuild (BLD), and Hamilton Lane (HLNE). The significant absolute detractors were Booz Allen Hamilton, TopBuild, and Floor & Décor (FND).
- During the quarter, we initiated positions in seven new investments: Rambus (RMBS), Entegris (ENTG), Bentley Systems (BSY), Insight Enterprises (NSIT), Pure Storage (PSTG), Willscot Holdings (WSC), and Dutch Bros (BROS). We also added to several existing positions.
- We eliminated six positions—Euronet Worldwide (EEFT), Aspen Technology (AZPN), Fox Factory Holding (FOXF), Tyler Technologies (TYL), Clearwater Analytics (CWAN), and Alarm.com (ALRM)—and trimmed several existing positions.
- There are many examples of high beta, AI-adjacent growth companies outperforming the broader investable universe. While we did not own these stocks due to their low quality, which hurt our performance, we believe the Portfolio is well-positioned to benefit from the GenAI-driven transformation—albeit in a more sustainable, long-term-oriented manner.
|
The performance data quoted represents past performance and does not guarantee future results. Current performance may be lower or higher. Periods over one-year are annualized. Performance figures are presented gross and net of fees and have been calculated after the deduction of all transaction costs and commissions, and include the reinvestment of all income. Please reference the GIPS Report which accompanies this commentary. The commentary is not intended as a guarantee of profitable outcomes. Any forward-looking statements are based on certain expectations and assumptions that are susceptible to changes in circumstances. Opinions and views expressed constitute the judgment of Polen Capital as of the date herein, may involve a number of assumptions and estimates which are not guaranteed, and are subject to change. Contribution to relative return is a measure of a securities contribution to the relative return of a portfolio versus its benchmark index. The calculation can be approximated by the below formula, taking into account purchases and sales of the security over the measurement period. Please note this calculation does not take into account transactional costs and dividends of the benchmark, as it does for the portfolio. Contribution to relative return of Stock A = (Stock A portfolio weight (%) – Stock A benchmark weight (%)) x (Stock A return (%) – Aggregate benchmark return (%)). All company-specific information has been sourced from company financials as of the relevant period discussed. |
Commentary
As measured by the Russell 2500 Growth Index, U.S. SMID cap growth stocks were up 2.4% in the fourth quarter and 13.9% for 2024. In another volatile quarter, SMID cap stocks were up over 10% after November’s U.S. Presidential election but relinquished almost all those gains in December, with the U.S. Federal Reserve (Fed) setting the tone for a slower-than-expected interest rate reduction in 2025. Despite the volatility, our U.S. SMID Company Growth Portfolio returned 3.0% gross of fees and 2.7% net of fees, slightly outperforming the Index. This marked the end of a disappointing year in which the Portfolio returned 2.6% gross of fees and 1.4% net of fees, underperforming the 13.9% Index return.
Despite muted 2024 results, we believe the fundamentals of our Portfolio businesses are strong and improving. For much of the year, the Russell 2500 Growth performance was largely driven by crowded AI trades and companies that stood most to benefit from declining interest rates (housing, biotech, unprofitable “moonshot” companies like space exploration, quantum computing, etc). As evidence of this narrowness, the top 10 contributors to the 2024 Index performance accounted for more than 1/3 of its return. This is decidedly not a conducive environment for most profitable, high-quality companies to outperform, and for us, it represented a meaningful relative performance headwind. For our current holdings, the market’s time horizon seemed to shrink significantly with a heightened focus on AI, excessively punishing businesses that did not meet expectations for the quarter, far exceeding what their underlying fundamentals would justify. Last quarter, we highlighted Goosehead Insurance as an illustration—down 40% at one point and later rebounding 60% as fundamentals proved stronger than expected. We witnessed a continuation of this trend when companies reported earnings in October and November, which worked to our benefit in the fourth quarter.
Numerous lower-quality companies did not meet our Flywheel framework for quality, weighing heavily on relative performance. The most notable example is Super Micro Computer, up nearly 190% in the first half of the year and driving a notable headwind. Particularly frustrating in this scenario—Super Micro was reconstituted out of the index in late June and was down -62% in the second half of 2024. Many high-beta, AI-adjacent growth companies outperformed the broader investable universe. While we did not own these stocks due to their low quality, negatively impacting our returns, we believe the Portfolio is well-positioned to benefit from the GenAI-driven transformation in a more sustainable and long-term manner.
While volatility and narrowly defined, crowded trades in the Index have presented short-term challenges for our high-quality, concentrated Portfolio, we believe these dynamics create an excellent environment for stock pickers like ourselves with a long-term, business-owner mindset. We remain committed to our collaborative, rigorous research process to identify the best long-term SMID cap compounders. We aim to generate returns by identifying great underappreciated businesses for the duration of their long-term compounding potential. In environments like this, many are also overlooked due to the market’s short-term focus and inability to see past the next rate-cut decision. This has led to crowding in some securities and skittishness in others. We use our five-point Flywheel investment criteria to see past the noise and rely on our research process to take multiple perspectives and leverage our team’s extensive experience. We are disciplined about paying the right price to reach our mid-teens return target and often utilize our library of vetted Flywheel companies to wait for the right opportunity to buy when volatility works in our favor. As a result, we are excited about the prospects for our Portfolio even amid an uncertain economic environment.
Portfolio Performance & Attribution
During the fourth quarter, the U.S. SMID Company Growth Composite Portfolio returned 3.0% gross and 2.7% net of fees, respectively, compared to the Russell 2500 Growth Index return of 2.4%.
The top contributors to the Portfolio’s relative and absolute performance in the fourth quarter were Revolve Group, Warby Parker, and Goosehead Insurance.
Revolve Group, an online apparel retailer targeting primarily Millennial and Gen Z demographics, was the top performer after demonstrating improving fundamentals following a challenging period, with the stock’s total return up over 100% for the year. While the consumer environment remains under pressure, we are encouraged by the company’s efforts to drive cost efficiencies, reduce return rates, expand product lines, and continue its international push. We believe Revolve is well-positioned to grow earnings at an accelerating rate over the near term while the long-term outlook remains intact.
Warby Parker, a U.S.-based omnichannel retailer of eyewear products with a unique vertically integrated direct-to-consumer business model, reported encouraging quarterly results. The company experienced strong growth in its glasses business and continued momentum in contact lenses and optometry.
Investment in optometrists is yielding results, driving improved gross margins through enhanced utilization. Warby Parker appears to be emerging from a challenging period where it was adversely impacted by post-pandemic changes in consumer behavior. Company management’s steps to reduce costs appear to be paying off. More recently, we’ve seen fundamentals improve, with marketing spend recovering now that margins have settled. We believe the company has the potential to enhance its profitability as demand continues to recover and it completes and capitalizes on heavy investments in areas such as optometry services, which previously weighed on margins.
Goosehead Insurance, a digitally enabled insurance brokerage business, was a top contributor on the back of positive earnings results including a rising 2024 revenue guidance. The company continues to execute well amidst a challenging macro backdrop, driving robust expense management, higher productivity, and compelling agent headcount growth.
The most significant detractors from relative performance in the quarter were Booz Allen Hamilton, TopBuild, and Hamilton Lane. The significant absolute detractors were Booz Allen Hamilton, TopBuild, and Floor & Décor Holdings.
Booz Allen Hamilton faced pressure during the period, not due to fundamental business weakness but rather concerns surrounding the Trump administration’s proposed Department of Government Efficiency (DOGE). Led by Elon Musk and former Republican presidential candidate Vivek Ramaswamy, DOGE has been mandated to curtail government spending, including payments to government contractors like Booz Allen Hamilton, which derives nearly 100% of its revenues from the U.S. government. While we view these concerns as more noise than reality, we are monitoring developments closely and will react accordingly.
TopBuild, a U.S. market leader in insulation distribution and installation services in the residential construction, commercial, and mechanical insulation markets, was weak over the quarter after posting soft quarterly results. We believe the company offers exposure to secular tailwinds from years of underbuilding in new homes and a high-return business model that should prove more resilient than traditional homebuilders.
Hamilton Lane is a private markets advisory and funds business serving primarily institutional investors. A robust performer for the better part of 2024, the stock came under pressure in the back half of the quarter, which coincided with rising rates in anticipation of the Fed pulling back on its 2025 rate cut expectations. We maintain our belief that the company is well-positioned given the growth in private markets across asset classes, as well as Hamilton Lane’s highly durable and recurring fee revenue and fee earnings.
Portfolio Activity
During the quarter, we initiated new positions in Rambus, Entegris, Bentley Systems, Insight Enterprises, Pure Storage, Willscot Holdings, and Dutch Bros. We also added to several existing positions.
Rambus plays a foundational role in fueling innovation in the data center and server environments, serving large memory OEMs (Original Equipment Manufacturers) and hyperscalers. With its fabless model, Rambus generates robust free cash flow while maintaining a steady R&D reinvestment to sustain its industry-leading memory interface chips and silicon IP solutions. We estimate Rambus is well-positioned to compound earnings and free cash flow per share at a high-teens rate through the cycle.
Entegris is a leading supplier of materials and process solutions focused primarily on the semiconductor industry. The company has developed expertise in various chemicals, gases, and filtration solutions that support the most advanced semiconductor growth manufacturing processes. The business has recently seen weaker-than-expected growth in its mature nodes business, which we expect to normalize into 2025 and 2026. Overall, we think materials, gas filtration, and handling—all Entegris core competencies—will be increasingly important in enabling semiconductor industry advances. We expect Entegris to deliver sustainable high-teens EPS growth on the back of double-digit revenue growth and margin expansion from operating leverage.
Bentley Systems is a long-established leader in infrastructure engineering software—specifically horizontal infrastructure networks such as roads, bridges, rail and transit, water and wastewater, utility grids, and the resources sector. Over 40 years, Bentley has developed comprehensive solutions for infrastructure engineering, covering all aspects of a project lifecycle. The company is actively extending its moat by investing in new technologies like digital twins (virtual models of a physical object, process, or system that uses real-time data to simulate its behavior in the real world) and AI to enhance its offerings and address the growing demand for infrastructure and asset intelligence. Bentley only went public in late 2020 but has a long track record as a classic compounder, achieving a +8% CAGR (Compound Annual Growth Rate) in total revenues over more than 20 years. Bentley boasts high and expanding operating and free cash flow margins, a resilient balance sheet, robust returns on capital, and a highly recurring revenue model. We believe we are paying a fair FCF (free cash flow) multiple for a mission-critical, stable business benefitting from several secular tailwinds and guided by an aligned, long-term-oriented management team.
Insight Enterprises is a global provider of IT solutions to small- and medium-sized businesses across various end markets. Insight has developed capabilities in hardware management and software and services and has demonstrated an impressive long-term track record of double-digit returns on invested capital and robust free cash flow generation. The company has cemented itself as a critical partner to its clients’ digital transformation initiatives. Our research suggests Insight will benefit from a return to normal IT spending levels in the coming years as companies prioritize hardware upgrades and continue to migrate workloads to the cloud. We estimate Insight will compound earnings per share at 18% over the next 5 years, driven by its deep customer relationships and leading cloud services business.
Pure Storage provides data storage solutions primarily to enterprise customers with private clouds and, more recently, hyperscalers. Pure stands out as a high-performance, all-flash storage provider with no legacy hard disk business. Its competitive advantage stems from its DirectFlash modules, the custom-built NAND flash chips managed by the company’s proprietary Purity software. DirectFlash’s advantages include higher storage capacity, longer life span, and better performance with lower latency. This translates to a premium, high-performance offering that generates high gross margins of ~70%, which we expect to grow over time. Although enterprise data storage demand has been muted compared to computing or server demand, we believe storage demand will accelerate, driven by GenAI and overall IT spending recovery. Historically, enterprise customers have been willing to pay up for performance, while hyperscalers opted for low-cost, bulk storage solutions. This dynamic is shifting as Pure’s all-flash storage system allows for superior energy savings compared to traditional hard disc storage. As a result, Pure has won its first hyperscaler contract, and we expect such success to continue. The net result is growing EPS and cash flow. We expect Pure’s earnings to grow at a 20% CAGR with increasing returns on invested capital.
Willscot Holdings provides turnkey space and storage solutions with leading market share in North America, serving customers through 250 branch locations. The company offers mobile offices, portable storage containers, climate-controlled storage, clear-span structures, and associated services, including delivery and installation. The business model is highly predictable as assets are leased with an average duration of three years—this stability has enabled management to allocate capital effectively. Construction markets (industrial, non-residential, and residential) have been sluggish over the last few years, and we anticipate an improved volume backdrop ahead. We expect this, combined with continued pricing gains through higher attach rates of their Value-Added Services, to lead to mid-teens EPS growth over the next five years.
Dutch Bros, a drive-through coffee and beverage company with nearly 1,000 locations, reported compelling quarterly results, raising its full-year revenue and EBITDA (Earnings Before Interest, Taxes, Depreciation, and Amortization) guidance. Robust same-store sales and steady unit growth have driven top-line growth of +28% year-over-year. Earnings growth appears poised to accelerate as the company ramps up unit growth in 2025, innovates its menu (into the untapped opportunity to drive food sales), and margins inflect higher with scale. We believe it’s still early days for Dutch Bros, which has a unique concept and is just starting to tap into proven value drivers like online ordering and food. We believe Dutch Bros has the potential to be a substantially long-duration EPS (earnings per share) growth business.
We eliminated six positions—Euronet Worldwide, Aspen Technology, Fox Factory Holdings, Tyler Technologies, Clearwater Analytics, and Alarm.com—and trimmed several existing positions.
We exited Euronet Worldwide given our caution about the existential challenges facing its ATM business due to the rapid shift toward a cashless society. We believe this limits the company’s appreciation potential even if the fundamentals remain attractive. While we still see Euronet as a high-quality business, we identified better opportunities for our capital.
We exited our position in Aspen Technology due to its announced acquisition, which we think limits its future return potential.
We sold our position in Fox Factory Holdings, which has been an unsuccessful investment. Fox Factory makes high-end shocks for bicycles and powered vehicles. The company was negatively impacted by pandemic disruptions in the bicycle supply chain.
While these headwinds have abated, the company faces additional weakness in its powered vehicles segment, which we expect to continue due to growing dealer inventories and a myriad of issues at the auto OEMs. Given new stock ideas, we believe Fox Factory will weather this challenging period, but we don’t see it as the best opportunity for our capital.
Over several quarters, we have used our investment in Tyler Technologies as a source of funds and fully exited our position in the quarter. We see it as a high-quality, attractive business focused on software serving the public sector, which has been a successful investment in our view, achieving a $25B market cap. Nonetheless, we view the stock’s return potential as less compelling following its robust performance.
We moved on from Clearwater Analytics after substantial share price appreciation led to valuation levels that diminished its relative attractiveness in the portfolio.
Finally, we exited our position in Alarm.com, the cloud, SaaS-based (Software as a Service) software platform for residential and commercial security companies. While we still view Alarm as a high-quality business, the EPS growth and return profile no longer compare favorably to newer ideas in our pipeline. Consistent with our best ideas and opportunity cost-driven mindset, we sold out of the position.
During the quarter, we added to and trimmed existing holdings that largely reflect the opportunity cost mindset noted above. We added to positions with better risk-reward profiles and stronger Flywheels and trimmed positions based on valuation to fund new positions and add to existing holdings. We added to our positions in Booz Allen Hamilton, Paycom Software (PAYC), Floor & Décor, and Trex (TREX) and trimmed positions in Goosehead Insurance, Houlihan Lokey (HLI), and Hamilton Lane.
Outlook
Looking to 2025 and beyond, we are optimistic about our Portfolio companies’ EPS growth outlook and the relatively low valuations for SMID cap stocks. We think business fundamentals will likely continue to improve due to growing evidence suggesting 2024 was the EPS bottom for SMID caps broadly, and the M&A market may continue to improve on early gains in 2024. Under the Trump presidency, we believe reduced regulation and prioritized domestic businesses may disproportionately benefit SMID cap companies, which derive most of their revenue from the U.S.
We don’t expect persistent uncertainty to limit our ability to achieve our long-term return targets, as the fundamentals of our Portfolio businesses and potential for superior earnings growth will ultimately drive the stocks. While we can’t predict how 2025 will unfold, we are prepared for continued volatility with economic uncertainty and shifting interest rate expectations. We aim to invest in resilient businesses that can self-fund their growth. This is a key tenet of our Flywheel investment criteria, which we uphold in good times and bad.
Thank you for your interest in Polen Capital and the U.S. SMID Company Growth Portfolio. Please contact us with any questions.
Sincerely,
Rayna Lesser Hannaway, CFA
Whitney Young Crawford
|
Important Disclosures & Definitions: Disclosure: This commentary is very limited in scope and is meant to provide comprehensive descriptions or discussions of the topics mentioned herein. Moreover, this commentary has been prepared without taking into account individual objectives, financial situations or needs. As such, this commentary is for informational discussion purposes only and is not to be relied on as legal, tax, business, investment, accounting or any other advice. Recipients of this commentary should seek their own independent financial advice. Investing involves inherent risks, and any particular investment is not suitable for all investors; there is always a risk of losing part or all of your invested capital. No statement herein should be interpreted as an offer to sell or the solicitation of an offer to buy any security (including, but not limited to, any investment vehicle or separate account managed by Polen Capital). Recipients acknowledge and agree that the information contained in this commentary is not a recommendation to invest in any particular investment, and Polen Capital is not hereby undertaking to provide any investment advice to any person. This commentary is not intended for distribution to, or use by, any person or entity in any jurisdiction or country where such distribution or use would be contrary to local law or regulation. Unless otherwise stated in this commentary, the statements herein are made as of the date of this commentary and the delivery of this commentary at any time thereafter will not create any implication that the statements are made as of any subsequent date. Certain information contained herein is derived from third parties beyond Polen Capital’s control or verification and involves significant elements of subjective judgment and analysis. While efforts have been made to ensure the quality and reliability of the information herein, there may be limitations, inaccuracies, or new developments that could impact the accuracy of such information. Therefore, this commentary is not guaranteed to be accurate or timely and does not claim to be complete. Polen Capital reserves the right to supplement or amend these slides at any time, but has no obligation to provide the recipient with any supplemental, amended, replacement or additional information. Any statements made by Polen Capital regarding future events or expectations are forward-looking statements and are based on current assumptions and expectations. Such statements involve inherent risks and uncertainties and are not a reliable indicator of future performance. Actual results may differ materially from those expressed or implied. The Russell 2500® Index is a market capitalization weighted index that measures the performance of the small to mid-cap growth segment of the U.S. equity universe. It is comprised of 2,500 of the smallest securities in the Russell 3000® Index. The index is maintained by the FTSE Russell, a subsidiary of the London Stock Exchange Group. It is impossible to invest directly in an index. The performance of an index does not reflect any transaction costs, management fees, or taxes. Past performance is not indicative of future results. Source: All data is sourced from Bloomberg unless otherwise noted. All company-specific information has been sourced from company financials as of the relevant period discussed. Definitions: Flywheel framework: Polen Capital’s framework to assess a company’s quality aimed at supporting sustainable growth. It is comprised of five self-reinforcing elements: 1) unique positioning, 2) repeatable sales process, 3) robust business model, 4) effective management, and 5) value-creating reinvestment. Fabless: a business model in which a company designs and markets semiconductors but outsources manufacturing to third-party foundries. This model allows the company to focus on innovation while relying on partners to produce the chips. Mature nodes: an older semiconductor manufacturing process with larger feature sizes that is cost-effective and widely used for applications like automotive and analog devices, where leading-edge performance is not required. Original Equipment Manufacturers (OEM): a company that produces components or products that are used in another company’s end products. OEMs might manufacture hardware or parts that are integrated into devices sold under another brand’s name. In the tech industry, it often refers to manufacturers supplying parts like chips or software to larger system producers. Hyperscalers: large technology companies that build and operate extensive, scalable cloud infrastructure to support robust computing, storage, and networking capabilities. They provide cloud services to businesses and individuals, enabling rapid scaling of resources. EPS Growth: the percentage increase in a company’s earnings per share over a specific period, indicating its profitability growth and ability to generate higher earnings for shareholders. Compound Annual Growth Rate (OTC:CAGR): annual rate of return that would be required for an investment to grow from its beginning balance to its ending balance. Calculated by annualizing the rate of return over the measurement period. Free cash flow multiple: a valuation metric comparing a company’s market cap to its free cash flow, indicating how much investors are willing to pay for each dollar of free cash flow the company generates. Headwind: a factor or condition that can impede the performance or growth of investments, sectors, or entire economies. These obstacles could be economic, political, or market-related and can negatively affect investment returns. Tailwind: a favorable condition or factor that can propel asset prices or financial markets upwards. These can include economic growth, technological advancements, regulatory changes, or other external influences that enhance the performance of investments. Earnings Before Interest, Taxes, Depreciation, and Amortization (EBITDA): a metric used to determine a company’s financial performance and gauge its profitability before non-core expenses and charges. It is calculated by taking net income and adding interest, taxes, depreciation, and amortization back to it. Contribution to relative return: a measure of a security’s contribution to the relative return of a portfolio versus its benchmark index. The calculation can be approximated by the below formula, taking into account purchases and sales of the security over the measurement period. Please note this calculation does not take into account transactional costs and dividends of the benchmark, as it does for the portfolio. Contribution to relative return of Stock A = (Stock A portfolio weight (%) – Stock A benchmark weight (%)) x (Stock A return (%) – Aggregate benchmark return (%)). All company-specific information has been sourced from company financials as of the relevant period discussed. |
Read the full article here