


In our previous analysis of ON Semiconductor Corporation aka onsemi (NASDAQ:ON), we highlighted SiC as the main growth driver for the company’s PSG segment, with a 5-year forward average revenue growth of 122%. Furthermore, we identified the company’s competitive advantage with its wide product portfolio breadth of SiC products.
Despite our optimistic outlook for the company’s revenue growth in 2023, the actual results deviated significantly from our projections. The most substantial variance occurred in the PSG segment, where we anticipated robust growth propelled by SiC demand. Furthermore, the actual revenue growth in the ASG segment for 2023 differed by 21.4% from our forecast, while the ISG segment showed a smaller deviation of 5.2%.
Given that our forecasts for the PSG (excluding SiC), ASG, and ISG segments were based on the company’s historical 7-year average revenue growth, this notable difference in 2023 revenues prompted us to examine the sustainability of onsemi’s revenue growth going forward. Consequently, we reevaluated the primary growth drivers across segments and adjusted our revenue forecast accordingly.
|
Revenue Breakdown by Segment ($ mln) |
Our Forecast 2022 |
Our Forecast 2023 |
Actual 2022 |
Actual 2023 |
Difference 2022 |
Difference 2023 |
|
PSG |
4,183 |
5,591 |
4,208 |
4,449 |
||
|
Growth % |
21.6% |
33.7% |
22.4% |
5.7% |
0.7% |
-27.9% |
|
ASG |
2,854 |
3,111 |
2,841 |
2,489 |
||
|
Growth % |
18.9% |
9.0% |
18.4% |
-12.4% |
-0.5% |
-21.4% |
|
ISG |
1,230 |
1,331 |
1,277 |
1,316 |
||
|
Growth % |
36.5% |
8.2% |
41.7% |
3.0% |
5.2% |
-5.2% |
|
Total |
8,267 |
10,034 |
8,326 |
8,253 |
||
|
Growth % |
22.7% |
21.4% |
23.5% |
-0.9% |
0.9% |
-22.3% |
Source: Company Data, Khaveen Investments.
Segment Performance
In the first section, we examined the reasons for the revenue decline of onsemi in 2023. onsemi categorizes its revenue based on three different breakdowns:
Company Data, Khaveen Investments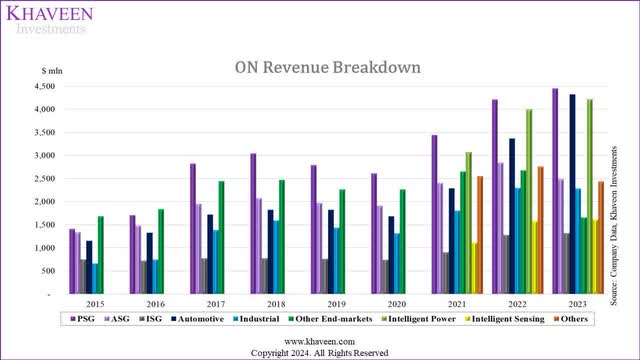
In our comprehensive breakdown chart, we combined all segments into a single representation. From 2021-2023, the largest three segments in terms of revenue growth were ISG (46%), Automotive (89%), and Intelligent Sensing (44%). In terms of US dollars increase, PSG, Automotive, and Intelligent Power were the largest three segments with an increase of $1.0 bln, $2.03 bln, and $1.14 bln in revenue from 2021-2023.
While the rest of the segments displayed revenue growth from 2021 to 2023, only the Other End-markets and the Other segments experienced a decline in revenue over those years (-38% and -5% respectively). The largest increase in revenue in the year 2023 was $0.96 bln from the Automotive segment. PSG only increased by 0.241 bln, while ASG decreased by 0.35 bln, and ISG increased slightly. This means PSG can only explain 25.1% of the $0.96 bln rise in the Automotive segment. As the other segments have not increased, this implies an internal shift of revenues between the three segments, which caused the rise of the Automotive segment by $0.96 bln and the decline of the Other End-markets by $1.02 bln.
To confirm this, we examined the company website, its annual reports, and earnings briefings, we compiled a table of onsemi’s product groups and categorized them according to their Operating Strategy, Product Technologies, and End-Market.
|
Product Groups |
Operating Strategy |
Product Technologies |
End-Market |
|
Wireless Connectivity |
ASG |
Intelligent Power |
Automotive |
|
Discrete & Power Modules |
PSG |
Intelligent Power |
Automotive/Industrial |
|
Power Management |
ASG |
Intelligent Power |
Automotive |
|
Signal Conditioning & Control |
ASG |
Intelligent Sensing |
All |
|
Sensors |
ASG/ISG |
Intelligent Sensing |
Automotive/Industrial |
|
Motor Control |
ISG |
Intelligent Power |
Automotive/Industrial |
|
Custom & ASSP |
ASG |
All |
All |
|
Interfaces |
ASG/PSG |
Intelligent Power |
Others |
|
Timing, Logic & Memory |
ASG/PSG |
Intelligent Power |
Industrial |
Source: Company Data, Khaveen Investments.
As seen, our research confirms that the product groups are spread across all segments, making it difficult to attribute the company’s performance to any one segment from the overall chart above. As such, we look into each of the company’s three revenue breakdowns to identify any common factors that can be used to explain their revenue performance.
Revenue by Operating Strategy
Company Data, Khaveen Investments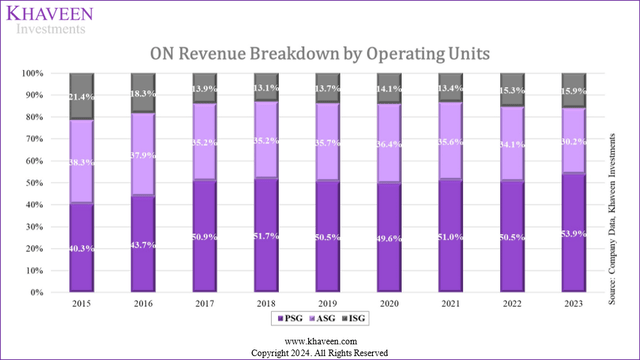
From the chart, over the past 8 years, PSG has increased its share of revenue from 40.3% to 53.9%, maintaining the biggest segment under the Operating Units breakdown. In contrast, ASG and ISG’s shares of revenue both decreased by 8.1% and 5.5% respectively during the same period.
|
Revenue by Operating Strategy ($ mln) |
2021 |
2022 |
2023 |
3Y Average |
|
PSG |
3,439 |
4,208 |
4,449 |
|
|
Growth % |
32.0% |
22.4% |
5.7% |
20.0% |
|
ASG |
2,400 |
2,841 |
2,489 |
|
|
Growth % |
25.6% |
18.4% |
-12.4% |
10.5% |
|
ISG |
901 |
1,277 |
1,316 |
|
|
Growth % |
22.0% |
41.7% |
3.0% |
22.2% |
|
Total Revenue |
6,740 |
8,326 |
8,253 |
|
|
Growth % |
28.3% |
23.5% |
-0.9% |
17.0% |
Source: Company Data, Khaveen Investments.
Looking further into the segments’ revenue in the last three years, PSG revenue growth exhibited an average of 20%, but it was still lower than ISG’s average revenue growth of 22.2% despite a higher US dollar value. ASG has the lowest average growth overall with 10.5%, and it even experienced a negative 12.4% growth in 2023. Overall, revenue peaked in 2022 at $8,326 million, then slightly decreased to $8,253 million in 2023, marking a -0.9% change. Despite fluctuations, the three-year average growth rate stands at a healthy 17.0%. We reviewed management’s highlights regarding the underlying reasons for the decline in the operating units segment based on the end market.
|
End-market Contributions |
Q4 2023 |
Q3 2023 |
Q4 2022 |
Most related end-market |
|
PSG |
Automotive, Industrial |
Automotive, Industrial |
Automotive, Industrial |
Automotive, Industrial |
|
ASG |
Others |
Others |
Others, Automotive, Industrial |
Others |
|
ISG |
Others, Industrial |
Industrial |
Automotive |
Industrial |
Source: Company Data, Khaveen Investments.
In summary, PSG revenue was primarily impacted by the automotive and industrial end markets, while ASG was mostly influenced by the “Others” end market, and ISG was mostly affected by the industrial end market. However, since there is a mix of end markets attributed to each operating unit, and given the company’s announcement of a change in its business group structure starting from Q1 2024, we believe it is no longer relevant to forecast revenue based on the current operating unit segments.
Revenue by Product Technologies
Company Data, Khaveen Investments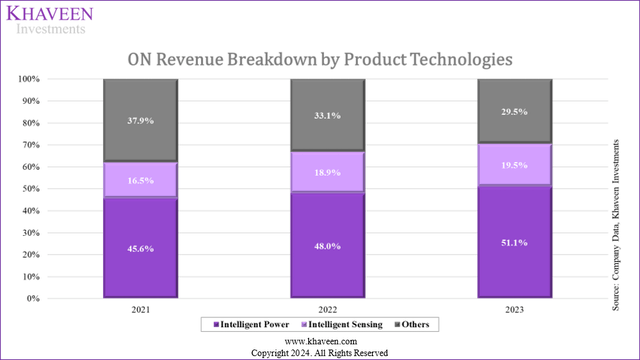
onsemi only established this revenue breakdown in 2021. Over the past 3 years, Intelligent Power has increased its share of revenue by 5.5%, maintaining the biggest segment under Product Technologies breakdown. Intelligent Sensing also experienced an increase in the share of revenue by 3.0%, while the Others segment saw a large decline of 8.4%.
|
Revenue Breakdown by Product Technologies ($ mln) |
2021 |
2022 |
2023 |
2Y Average |
|
Intelligent Power |
3,074 |
3,997 |
4,215 |
|
|
Growth % |
30.1% |
5.4% |
17.7% |
|
|
Intelligent Sensing |
1,114 |
1,574 |
1,607 |
|
|
Growth % |
41.3% |
2.1% |
21.7% |
|
|
Others |
2,552 |
2,755 |
2,431 |
|
|
Growth % |
8.0% |
-11.8% |
-1.9% |
|
|
Total |
6,740 |
8,326 |
8,253 |
|
|
Growth % |
28.3% |
23.5% |
-0.9% |
17.0% |
Source: Company Data, Khaveen Investments.
From the table, Intelligent Power has a larger revenue in U.S. dollars compared to Intelligent Sensing. However, its average revenue growth of 17.7% is lower than Intelligent Sensing’s growth of 21.7%. Despite this difference, both segments’ growth rates are relatively aligned. While the table provides figures for revenue and growth rates, we lacked information on the factors driving the revenue growth for each segment, so we could not conclude any insights based on this breakdown.
Revenue by End Market
Company Data, Khaveen Investments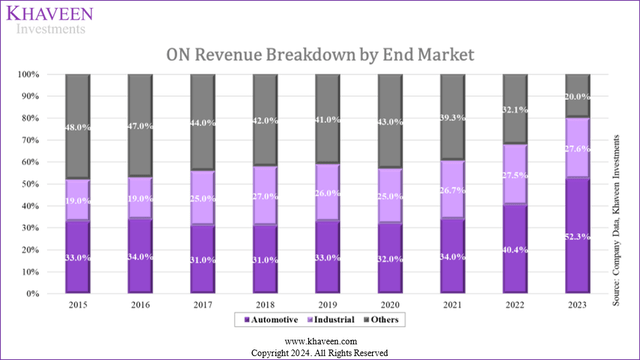
From the chart, over the past 8 years, the Automotive share of revenue surged from 33% in 2015 to 52.3%, becoming the biggest segment under the end market breakdown. Automotive, together with Industrial segment, contributed 79.9% of onsemi revenue in 2023, while it was only 52% in 2015.
|
Revenue Breakdown by End-Market ($ mln) |
2021 |
2022 |
2023 |
3Y Average |
|
Automotive |
2,289 |
3,361 |
4,320 |
|
|
Growth % |
36.1% |
46.8% |
28.5% |
37.2% |
|
Industrial |
1,802 |
2,291 |
2,278 |
|
|
Growth % |
37.2% |
27.1% |
-0.5% |
21.2% |
|
Other End-markets |
2,649 |
2,675 |
1,655 |
|
|
Growth % |
17.2% |
1.0% |
-38.1% |
-6.6% |
|
Total |
6,740 |
8,326 |
8,253 |
|
|
Growth % |
28.3% |
23.5% |
-0.9% |
17.0% |
Source: Company Data, Khaveen Investments.
The most significant change observed from 2021 to 2023 occurred in the Automotive segment, which saw an average increase of 37.2% over the three years, amounting to a substantial $2.63 billion rise in dollar value. Management highlighted that this surge in automotive revenue was propelled by both Intelligent Power and Sensing and attributed the growth to factors such as “vehicle electrification and Advanced safety features,” ADAS (automotive image sensors), and the Automotive “shift to higher value 8 megapixel sensors.” Moreover, the Industrial segment has a strong positive average revenue of 21.2%, despite a flat growth in 2023.
Conclusion
After analyzing the revenue across all three breakdowns, we observed that neither the Operating Units nor Product Technologies breakdowns could explain explicitly the decline in segments. Therefore, we believe the End Market breakdown is the most reflective of the company’s revenue performance. Additionally, the Automotive segment demonstrated the highest growth, surpassing other segments with an average growth rate of 37.2%, while Other end markets performed below par with an average of -6.6%. More importantly, it represented 52.3% of onsemi’s total revenue in 2023; thus, we believe the Automotive segment is the most important segment to look at to determine the sustainability of onsemi’s revenue.
Robust Growth Drivers
In the second point, we examined the company’s main growth drivers across the segments and identified the common drivers for the most growth segments.
Main Drivers Across End Markets
|
End market |
Source |
CAGR |
Growth Drivers |
|
Automotive |
MarketsandMarkets |
10.1% |
AI/ML, EV, ADAS, IoT Connectivity |
|
Industrial |
Data Bridge Market Research |
13.0% |
AI/ML, Robotics, IoT Connectivity, Factory Automation, Renewable Energy Infrastructure |
|
Smartphone |
Modor Intelligence |
4.1% |
5G, IoT Connectivity |
|
PC |
Our forecast |
6.8% |
AI/ML, IoT Connectivity |
|
Communications Infrastructure |
Statista Market Insights |
6.7% |
5G, IoT Connectivity |
|
Consumer Electronics |
Statista Market Insights |
3.0% |
XR/VR/AR, IoT Connectivity |
|
Data Center |
Statista Market Insights |
6.6% |
Cloud Computing, Edge Computing, AI/ML, IoT Connectivity |
|
Average |
7.2% |
Source: MarketsandMarkets, Data Bridge Market Research, Modor Intelligence, Statista Market Insights, Khaveen Investments.
From the table, Automotive and Industrial have the highest CAGR (10.1% and 13% respectively), which we believe aligns with the management strategy to shift to “high-growth megatrends[A5].” Our calculated average CAGR stands at 7.2%, consistent with onsemi’s eight-year average revenue growth rate (excluding the revenue impact of the 2017 acquisition). Within the Automotive industry, we identified electric vehicles (EVs), Advanced Driver Assistance Systems (ADAS), and Internet of Things (IoT) connectivity as key growth drivers. Given that the Automotive segment represents onsemi’s most rapidly growing segment from 2021 to 2023, with an impressive average revenue growth of 37.2%, we examined the factors of these drivers and explored opportunities for further capitalization by onsemi.
EV
IEA, Khaveen Investments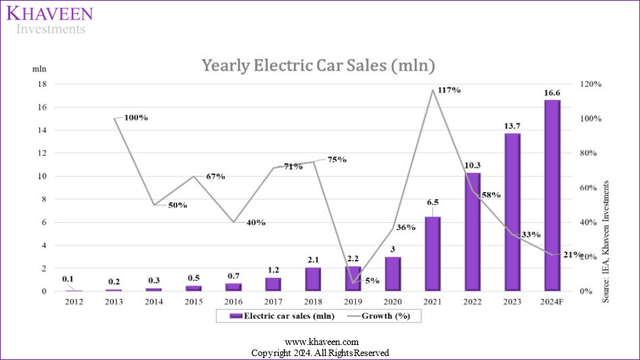
Electric Vehicles (EVs) are one of the main drivers of the Automotive industry. According to IEA, EV sales represented for only 2% of total car sales in 2018. However, by 2023, this figure has surged to 18%, and approximately 1/5 of cars sold in 2023 were electric. From the chart, despite peaking at 117% growth in 2021, new car sales growth gradually stabilized in 2022-2023. IEA attributed the surge in EV sales in 2021 to extended subsidies in China and Europe, as highlighted in our previous analysis of TAN (TAN). Even though it seems like the growth has been slowed down, IEA still expects the sales in 2024 to increase by 21% compared to 2023. In addition, the number of countries where EV sales account for 5% of new car sales has increased from 19 in 2022 to 31 in 2023, further indicating the fast-growing demand for EVs. According to Fortune Business Insights, total global EV sales are expected to increase at a CAGR of 17.8% from 2023-2030.
According to onsemi, SiC, IGBT, and MOSFET, are the “cornerstones” of EVs or electrification in general. They replace traditional components and are often used in EV inverters and power electronics for different types of EVs to meet the requirements of power, efficiency, robustness, reliability, cost, size, and safety. Based on our analysis of the company’s products, we identified that these materials fall under the Power discrete and module technology, as presented on onsemi’s website. Yole Intelligence expects that the power module market size would double by 2028 with a CAGR of 12.8%. In 2022, onsemi held an 8.8% market share in the Power Discretes and Modules market, generating $2.5 billion in revenue, which accounted for 29.7% of onsemi’s total revenue that year. With the forecasted strong growth in EV sales and increasing demand for power discrete and modules technologies, we expect onsemi’s Automotive revenue to remain robust.
Omdia, Khaveen Investments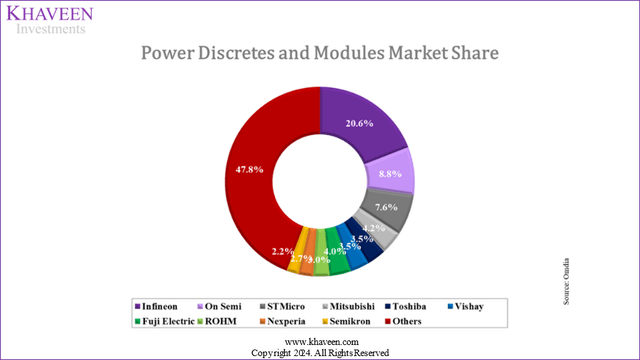
ADAS
Another strong growth driver in the automotive industry is Advanced Driver Assistance Systems (ADAS) which is anticipated to grow at a CAGR of 18.7% from 2022 to 2030 by Acumen Research and Consulting. With the strong demand for sensors (imaging, rada, LiDAR) to provide enhanced vehicle safety features, the Yole Group expects the raw sensor semiconductor content to increase from $51 to $82 per car. Furthermore, they expect the sensor market size for automotive applications to grow at a CAGR of 7% over the next five years.
onsemi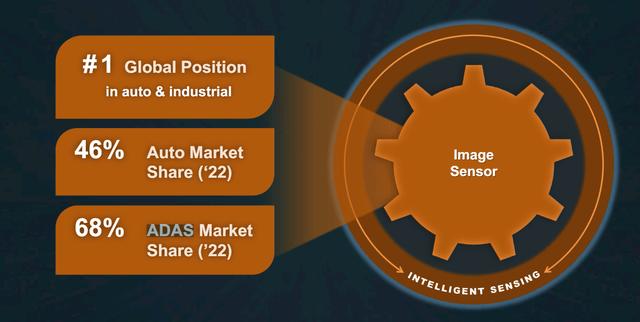
During the Investor Day in 2023, onsemi claimed that its ADAS market share for its image sensor was 68%. We mentioned in the first section that the company’s Intelligent Sensing exhibited the highest revenue growth within the Product Technologies breakdown, with a 2-year average of 21.6%. Management also highlighted in Q4 2023 Earnings Briefing that the automotive image sensors revenue in 2023 reached $1 bln, accounting for 12.5% of onsemi total revenue. Thus, we believe onsemi could capitalize on the growth in ADAS, particularly with its image sensor products, given the strong market position claimed by the management.
IoT Connectivity
The third growth driver in the automotive industry is IoT Connectivity, which refers to “the integration of internet-connected devices and sensors into vehicles to collect and exchange data.” This integration could help improve safety and reduce maintenance costs by alerting drivers through different features while enhancing driver experience with IoT-powered infotainment systems. The global vehicle networking market CAGR is 10%, driven by 5G connectivity adoption and more advanced networking protocols.
Additionally, as the automotive industry shifts towards zonal architectures and automated driving, Automotive Ethernet, notably the 10BASE-T1S protocol, is at the forefront of this revolution. With bandwidths expected to reach 100gbps, it is suitable for high-bandwidth applications such as Infotainment systems, cameras used in ADAS, interconnection backbones, and diagnostics. onsemi highlights that it offers a comprehensive product portfolio that covers existing and evolving protocols, including the focus on Automotive Ethernet 10BASE-T1S.
With the importance of 10BASE-T1S ethernet to the automotive industry continuing to increase, much of our development resources will be concentrated here. – onsemi.
Conclusion
|
onsemi’s Partnerships |
Before 2022 |
2022 |
2023 |
|
EV |
NA |
1 |
8 |
|
ADAS |
6 |
1 |
1 |
|
IoT Connectivity |
3 |
NA |
NA |
|
Others |
21 |
NA |
1 |
|
Total |
30 |
2 |
10 |
|
Total Automotive-related partnerships |
9 |
2 |
9 |
|
Automotive-related partnerships as % of Total Partnerships |
30% |
100% |
90% |
Source: onsemi.
We compiled the total number of onsemi’s partnerships recently. Based on the table, automotive-related partnerships have become onsemi’s focus starting in 2022 and 2023. We believe this information echoed the focus on high-growth segments from management.
Revenue Forecast
In the third point, we examined whether onsemi could achieve the CAGR highlighted by management and updated our revenue forecast based on the main growth drivers identified in the previous point.
onsemi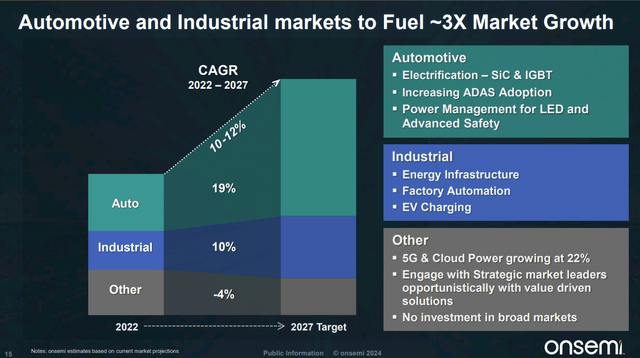
During the Q4 2023 Earnings Briefing, management highlighted the automotive and industrial markets to be their long-term focus, and they expect to achieve a CAGR of 10-12% over the next 3 years.
onsemi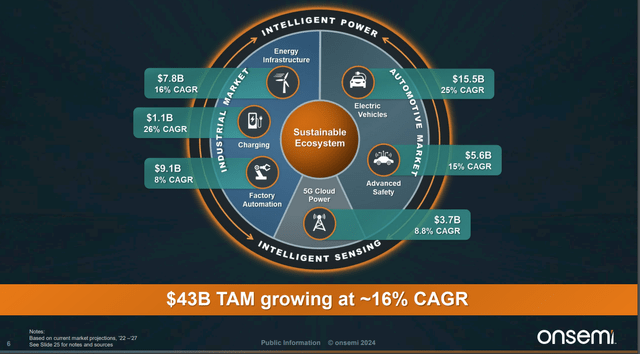
In addition, management expects the company’s TAM to grow at a CAGR of approximately 16%. However, this projection implies that the company’s growth rate may be slower than that of the overall market, which is estimated at 10-12% compared to 16%. Hence, we compiled a table of onsemi’s average historical revenue growth, management guidance, our calculated weighted CAGR, and Weighted TAM for the company’s end market segments, to assess which method is better suited for projecting the company’s future revenue.
|
End-markets |
2023 Breakdown (%) |
Average Historical (%) |
Weighted CAGR (%) |
Management Guidance (%) |
Weighted TAM (%) |
|
Automotive |
52.3% |
17.9% |
18.7% |
19% |
22.5% |
|
Industrial |
27.6% |
10.3% |
14.2% |
10% |
12.6% |
|
Others |
20.0% |
-2.5% |
5.4% |
-4% |
8.8% |
|
Average |
100.0% |
8.3% |
14.8% |
11.9% |
17.0% |
Source: Company Data, Khaveen Investments.
From the table, each approach yielded a distinct average CAGR. For the average historical method, the 8-year total revenue growth averaged 8.3%. However, factoring in the company’s 2023 revenue distribution, the average total revenue growth would escalate to 11.7%, in line with management guidance of 11.9% from 2022-2027. Among the four approaches, we believe the weighted CAGR from all growth drivers in each end market would be the most accurate approach to forecast onsemi’s revenue.
Outlook
|
onsemi Revenue Projection ($ mln) |
2023 |
2024F |
2025F |
2026F |
2027F |
|
Automotive Revenue |
4,320 |
4,367 |
5,185 |
6,197 |
7,407 |
|
Growth % |
28.5% |
1.1% |
18.7% |
19.5% |
19.5% |
|
Weightage % |
52.3% |
55.7% |
57.4% |
59.9% |
62.3% |
|
Industrial Revenue |
2,278 |
2,055 |
2,347 |
2,623 |
2,931 |
|
Growth % |
-0.5% |
-9.8% |
14.2% |
11.8% |
11.8% |
|
Weightage % |
27.6% |
26.2% |
26.0% |
25.4% |
24.7% |
|
Other End Market Revenue |
1,655 |
1,417 |
1,494 |
1,522 |
1,552 |
|
Growth % |
-38.1% |
-14.4% |
5.4% |
1.9% |
1.9% |
|
Weightage % |
20.0% |
18.1% |
16.5% |
14.7% |
13.1% |
|
Total Revenue |
8,253 |
7,839 |
9,026 |
10,343 |
11,890 |
|
Growth % |
-0.9% |
-5.0% |
15.1% |
14.6% |
15.0% |
|
Weightage % |
100% |
100% |
100% |
100% |
100% |
Source: Company Data, Khaveen Investments.
We based our forecast of onsemi revenue in 2024 on Q1 2024 results, management guidance in Q2, and the CAGR for Q3-Q4 when all markets recover. From 2025F onwards, we forecasted based on the weighted average CAGR. From the table, the automotive segment has the highest revenue growth, which increases the automotive weightage over time. We anticipate that the automotive segment’s revenue share will rise from 52.3% to 62.3% by 2027, while the Industrial segment’s revenue share will fall slightly, and the Other End market segment’s revenue share will fall from 20% to 13.1%.
Overall, this supports management’s focus on high-growth segments, which will result in higher total revenue growth over time, beginning in 2025. Our revenue growth forecast is higher than analysts’ consensus forecast, as we expect onsemi to capitalize on the growth drivers in the automotive and industrial markets.
Risk: Automotive Semiconductor Surplus
The automotive industry, which previously encountered severe semiconductor shortages, now faces a surplus, leading to concerns over reduced demand for vehicle semiconductors, particularly in the electric vehicle sector. onsemi’s management highlighted inventory digestion and demand slowdown in the latest earnings briefing. Moreover, SP Global highlighted an increase in inventory for automakers, and Mobileye also mentioned the pulled back in automaker customers to clear their excess inventory. Thus, we believe this surplus could raise new challenges and impact onsemi’s Automotive revenue.
Verdict
Khaveen Investments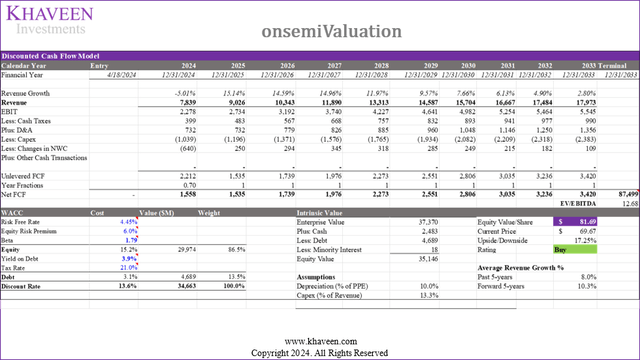
All in all, we believe onsemi revenue growth is still sustainable going forward, as our forecast forward 5-year average revenue growth is 10.3%, slightly higher than the past 5-year growth of 8.0% due to the shift to high-growth markets including automotive and industrial. We expect onsemi to capitalize on the automotive’s growth drivers due to its wide range of products, such as the power discrete and modules, sensors, and automotive Ethernet standards. After examining its average historical growth, management guidance, management TAM, and our weighted CAGR, we projected onsemi’s revenue growth going forward at a robust average of 10.3%.
We updated our discounted cash flow (“DCF”) valuation, retaining similar assumptions from our previous analyses. Based on a discount rate of 13.6% (company’s WACC) and terminal value based on the company’s historical average 5-year EV/EBITDA of 12.68x, we derived an upside of 17.25% with a target price of $81.69, thus maintaining our Buy rating. Even though this target price is in line with our previous target price of $83.63, we derived a lower upside as the company’s share price has increased by 9.1% since our last coverage in Dec 2022.
Read the full article here