


In this article I am going to outline my thoughts on where I am allocating money as the summer months approach. I will be using technical analysis to determine if it is better to invest in the SPDR S&P 500 ETF (NYSEARCA:SPY) or the Vanguard Extended Market ETF (VXF). Most people know that investing in SPY is investing in the S&P 500 index. The biggest companies. Investing in VXF is investing in small and mid-cap companies, not the biggest capitalization companies which SPY owns. The technical tools I will use are a monthly price chart with the 10-month exponential moving average (EMA), and monthly relative strength chart comparing the performance of SPY to VXF. First I will analyze SPY in isolation.
Chart 1 – SPY Monthly with 10-Month EMA
www.stockcharts.com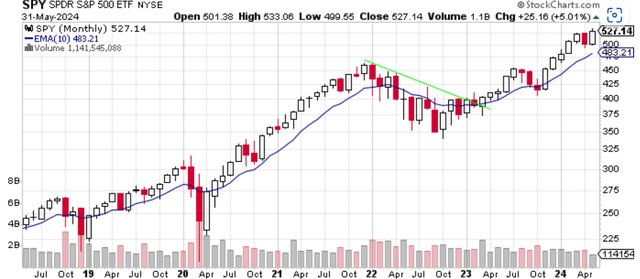
When observing Chart 1 you can see the benefits of looking at SPY compared to its 10-month EMA in blue over a long period of time. Chart 1 shows the last 6 years of price data for SPY. Simply looking at the chart you can see that it paid off to own SPY when it was trading above its 10-month EMA. I like the 10-month EMA as it is a long-term moving average like the 200-day moving average on a daily chart which many people are familiar with. The concept of using my methodology is simple. Whenever SPY is above its 10-month EMA that is bullish. I want to own stocks and ETFs that are bullish. You can see that when price crosses above the moving average, price tends to stay above that moving average for a long period of time. I want to continue to own the asset that is trading above the long-term moving average as it is now. SPY last crossed above its 10-month EMA in November 2023 and has remained above the 10-month EMA since. I will look to sell SPY if it closes the month below its 10-month EMA. A stock or ETF that trades below its 10-month EMA is bearish in my opinion. Keep in mind that this simple crossover strategy is not always successful. There are times like in October 2023 when price closed the month of October below the 10-month EMA. This indicates that you sell SPY. Well, that crossover signal proved to be false as SPY rose substantially in November 2023. Oh well, I understand that not all these signals are going to be correct, so I just accept that and move on. I do not know of any system, technical nor fundamental, that works all the time. Also note that this crossover trading system doesn’t get me in at the bottom of the market move, nor does it get me out at the top of the market. My goal with this system is to get the meat of the price move. Right now, Chart 1 shows four things that indicate that SPY is bullish. First, SPY is above its 10-month EMA. Second, the 10-month EMA is rising, which is also a bullish sign. Third, SPY closed above its previous month’s high. Fourth, SPY closed the month at a new all-time high. All-time highs are always bullish. In isolation, it would take a close below the 10-month EMA for me to not be bullish on SPY.
Chart 2 – VXF Monthly with 10-Month EMA
www.stockcharts.com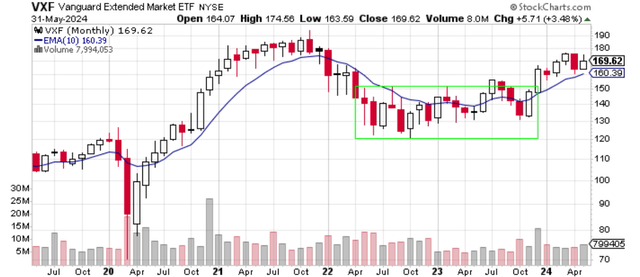
Chart 2 shows VXF in isolation and in isolation VXF is bullish. It is trading above its 10-month EMA. The 10-month EMA is also trending higher, which is a bullish sign. However, there are a few differences between Chart 1 and Chart 2. While VXF closed higher for the month by gaining 3.48%, VXF did not close higher than the previous month. It’s not the worst outcome, but it is a different outcome than that of SPY which managed to close above the previous month’s close. Also, VXF has a way to go before it reaches a new high which was last reached on November 2021. Chart 2 says that VXF is heading in the right direction, but that is a clear distinction between SPY and VXF. So, VXF is bullish as it is trading above the 10-month EMA and the 10-month EMA is trending higher which is also bullish. In isolation I can feel comfortable owning VXF. Now let’s look at a relative strength chart to see which ETF is better to own, if you must choose between the two.
Chart 3 – VXF:SPY Monthly Relative Strength with 10-Month EMA
www.stockcharts.com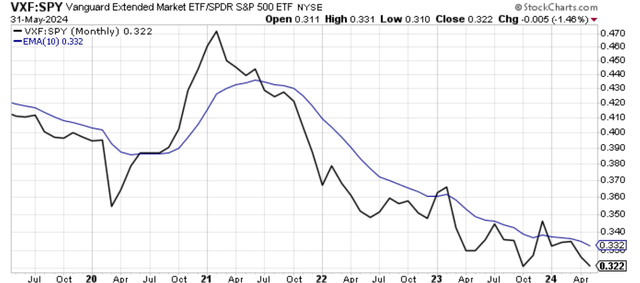
In my analysis, I find relative strength charts useful to determine where money should be allocated. This is an opportunity cost decision. I want my money to be allocated to the stocks or ETFs that are outperforming the SP 500 index. The index is very hard to beat, and to beat the index you have to own assets that outperform it over a long period of time. Relative strength charts are easy to read. The black line on the chart shows the ratio of price performance for VXF compared to SPY. When the black line is falling that means that VXF is underperforming SPY for that period. When the black line is rising then VXF is outperforming SPY for that period. We know from Chart 1 that SPY gained over 5% for the month of May. We know from Chart 2 that VXF gained 3.48% during the same period. VXF underperformed SPY and we can see that in Chart 3 as the black fell for the month of May. Long term, I like to use the 10-month EMA again as a guide. With just a couple of exceptions, VXF has underperformed SPY since January 2021. It has paid to be in SPY over VXF since January 2021 and Chart 3 would have helped an investor recognize that when the VXF:SPY ratio crossed below the 10-month EMA in June 2021. An investor would have been much better off owning SPY since June 2021 compared to owning VXF from the same date. As I mentioned previously, the 10-month EMA is a lagging indicator, and you must accept that you will never get into the market at the exact bottom and get out of the market at the exact top using the 10-month EMA as your guide. The idea is just to get the middle of a significant move. That is how I believe an ordinary investor can beat the SP 500 index. Looking at Chart 3 you can see that the VXF:SPY ratio is below its downward sloping 10-month EMA. In this case the smart play in my opinion is to simply own SPY over VXF until VXF can trade above its upward sloping 10-month EMA. For the start of summer, I am choosing to own SPY over VXF. Next month, I will reexamine the charts using the same system and determine if a change of allocation is necessary. Until then, I am long SPY.
Read the full article here