


We previously covered Realty Income (NYSE:O) in March 2024, discussing why we had maintained our Buy rating, with the REIT remaining well capitalized to fund its debt and dividend obligations, thanks to the elevated inflationary environment and the slower cap rate adjustments in FQ4’23.
Combined with the healthy balance sheet and secure payouts, we believed that dividend-oriented investors might still consider O as a viable long-term income strategy in a well-diversified portfolio.
Since then, O has traded sideways as the wider market recovers moderately by +3.1%. Even so, we believe that the REIT remains a Buy, thanks to the promising FQ1’24 earning results from its improved investment spread, reiterated FY2024 profit guidance, and consistently raised dividend payouts.
Combined with the stock’s inherent undervaluation compared to its historical means, we believe that opportunistic investors may continue to add this dividend aristocrat for rich yields, while waiting for a potential upward rerating in its valuations and consequently, upside gains upon a normalized macroeconomic environment.
O’s Aggressive Plan Has Delivered Robust Profitable Growth Thus Far
For now, O has reported a double beat FQ1’24 earnings call, with total revenues of $1.26B (+17.7% QoQ/ +34% YoY) and AFFO per share of $1.03 (+1.9% QoQ/ +5.1% YoY).
Much of its top-line tailwinds are attributed to the growing rental revenues (including reimbursable) to $1.2B (+17.5% QoQ/ +30.5% YoY) as the number of its new properties increases to 3.4K (+30.7% QoQ/ 120% YoY), further aided by the expansion in its same store rental revenues to $843.45M (+18.6% QoQ/ +0.7% YoY).
At the same time, O’s bottom-line growth has been excellent, thanks to the excellent spread on their cost of capital thus far. For context, the REIT reported a relatively low weighted average interest rate on its notes/ bond payable at 3.8% as of March 2024 (inline QoQ/ +0.4 points YoY).
With the REIT reporting FQ1’24 investments of $323M in the EU at an initial weighted average cash yield of 8.2% and $275M in the US at 7.3%, it is unsurprising that the management has reported an impressive “investment spread of over 340 basis points.”
This number has far exceeded the management’s long-term Weighted Average Cost of Capital at approximately 150 basis points, based on its stock equity and 10Y unsecured debt, underscoring the REIT’s ability to generate alpha despite the challenging market condition over the past three years.
Much of O’s success are naturally attributed to its high-quality real estate portfolio across 80 different industries, with the management laser focused on diversifying their risks with the top tenant, Dollar General (DG), only comprising 3.4% of the overall annualized contractual rent.
At the same time, readers must note that the REIT has entered a Joint Venture with a data center REIT, Digital Realty (DLR), allowing the former to tap into the booming Data Center market as the next growth opportunity, with generative AI driving the next cloud computing super cycle.
As a result of its highly profitable spread and robust portfolio diversification, it is unsurprising that O has been able to report excellent overall AFFO of $862.9M (+18% QoQ/ +32.6% YoY) in the latest quarter.
This is significantly aided by the higher lease recapture rates of 104.3% (+0.7 points QoQ/ +2.6 YoY/ +1.8 from the REIT’s 30Y average of 102.5%), similarly contributing to the higher same-store rent growth of +0.8% YoY (-1.8 points QoQ/ +0.6 YoY).
Despite the relatively higher investments of $8.45B over the last twelve months (-7.2% sequentially/ +127.7% from FY2019 levels of $3.71B), O’s balance sheet appears relatively healthy at net-debt-to-adj-EBITDA of 5.5x (pro-forma after the merger with Spirit) in FQ1’24, compared to 5.5x in FQ4’23, 5.4x in FQ1’23, and the Diversified REIT average leverage of 5.3x.
At the same time, the REIT’s AFFO payout ratio remains stable at 74.8% inline with the sector median of 73.7%, further underscoring its ability to sustain its dividend growth ahead as similarly highlighted by the Seeking Alpha Quant rating at B Grade.
This is why we believe that O remains on track to achieving its robust “operational return profile of approximately 10%, comprising an anticipated dividend yield close to 6% and AFFO per share growth of approximately +4.3%,” based on its excellent FQ1’24 results thus far.
So, Is O Stock A Buy, Sell, or Hold?
O 5Y Stock Price
Trading View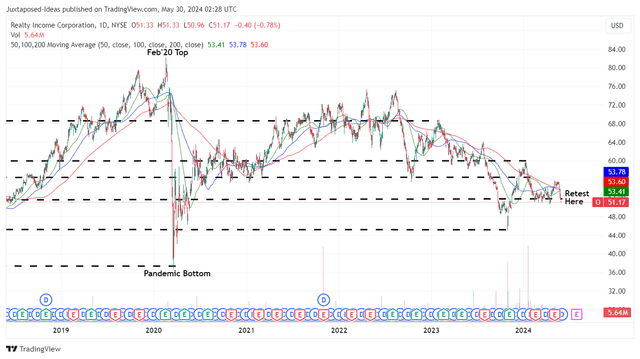
For now, O has continued to chart lower highs while retesting its previous support levels of $51s, with it remaining to be seen if these levels may hold.
Perhaps part of the pessimism is attributed to the fact that 82.2% of its leases provides for CPI-linked rental escalators/ percentage of clients’ gross sales, with the peaking inflation and a potential Fed pivot in 2024 potentially triggering top-line headwinds – one similarly faced by multiple REIT stocks.
O Valuations
Seeking Alpha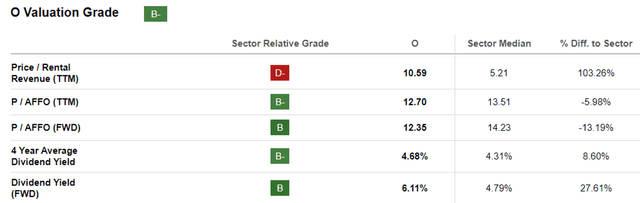
And this also explains why the O stock continues to be discounted at FWD Price/ AFFO valuations of 12.35x, compared to its 1Y mean of 13.41x, 3Y pre-pandemic mean of 19.13x, and the sector median of 14.23x.
Even so, when compared to its diversified REIT peers, such as Agree Realty (ADC) at FWD Price/ AFFO valuations of 14.40x, Getty Realty (GTY) at 11.65x, and W. P. Carey (WPC) at 11.93x, it is apparent that O still looks attractive here.
This is especially since O is expected to generate an excellent top/ bottom line growth at a CAGR of +4.9%/ +3.8% through FY2026, compared to GTY at -0.5%/ +2.7%, and WPC at +2.3%/ -1.4%, respectively, implying that the former is reasonably valued at FWD Price/ AFFO valuations of 12.35x for the excellent FQ1’24 results and the growth projections ahead.
Readers must also note that many REIT stocks remain discounted compared to their pre-pandemic means, with it only a matter of time before the macroeconomy normalizes.
As such, we believe that the O stock offers opportunistic investors with a great upside potential to our bullish long-term price target of $84, nearer to its 2019 trading averages of $75s.
This is based on the 3Y pre-pandemic Price/ AFFO valuation mean of 19x and the consensus FY2026 AFFO per share estimates of $4.47.
At the same time, O recently raised their monthly dividend payouts by +2.1% to $0.2625 per share, building upon its 5Y Dividend Growth Rate of 3.55%, with the stock’s pullback also triggering an expanded forward yields of 6.11%.
This is naturally higher than its 4Y average dividend yields of 4.68%, the sector median of 4.79%, and the US Treasury Yields at between 4.61% – 5.38%.
As a result of the compelling investment thesis across dividend payouts and potential capital appreciation, we are maintaining our Buy rating for the O stock here.
Read the full article here