

My thesis
Gold prices continue breaking new record highs in 2024 as geopolitical uncertainties mount, and I want to capitalize on this trend. Barrick Gold (NYSE:GOLD) looks like a Strong Buy opportunity to get high-quality exposure to booming gold prices.
The company is one of the largest in the world in this business and its exceptional operational efficiency became evident when I compared its profitability to the largest North American gold mining company. GOLD boasts a healthy balance sheet, and its operational efficiency is backed by its focus on the highest-quality assets.
GOLD invests substantial amounts in capex, which will likely help in expanding production volumes to support the top line, especially in the current favorable environment of high gold prices. The stock is attractively valued compared to the closest rival and from the dividend discount model perspective.
I expect gold prices to stay elevated further as investors will likely seek for a safe harbor as geopolitical situation in the world is becoming more complex and the Russia-Ukraine war recently moved to a new level of conflict escalation.
GOLD stock analysis
Barrick Gold Corporation is one of the world’s largest gold mining companies and its operations span across different continents. According to the latest annual report, the company produced 4.05 million ounces of gold and 420 million pounds of copper in 2023.
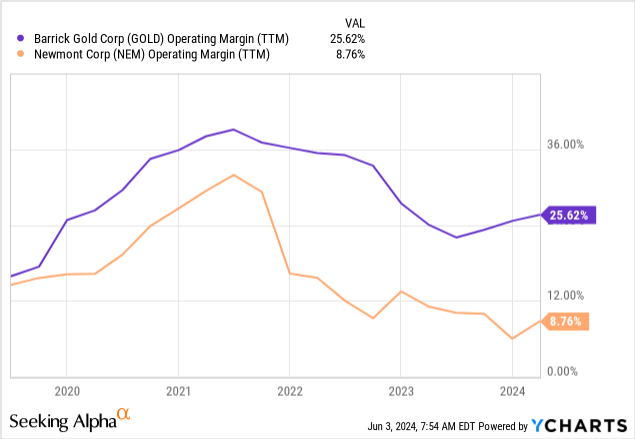
GOLD’s closest North American rival is Newmont Corporation (NEM), producing around 5.5 million ounces of gold in 2023. When deciding where to invest, I prefer to allocate my money to companies which are the most efficient in their industries. Looking at the operating margin dynamics of these two companies is a useful tool to understand which one is more efficient.
According to the below chart, GOLD has been consistently more efficient than NEM over the last five years and the gap is widening. Please also note that NEM produces almost 40% more gold than Barrick does, meaning that it has much more potential to capitalize on its scale advantages. Nevertheless, GOLD’s TTM operating margin is almost three times higher.
As a result of greater operating efficiency, GOLD also has a healthier balance sheet. The company’s cash reserve is by around $1.5 billion higher, and its debt is two times lower. GOLD’s payout ratio is around 45%, much lower compared to NEM as well. Therefore, I believe that from the dividend safety perspective, GOLD is also a better option for investors. Moreover, the forward dividend yield is almost identical at around 2.3%.
Seeking Alpha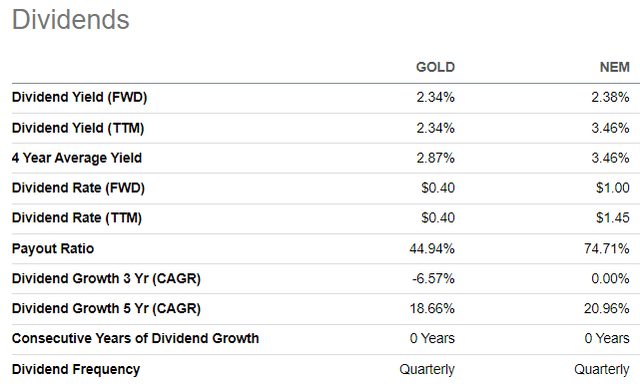
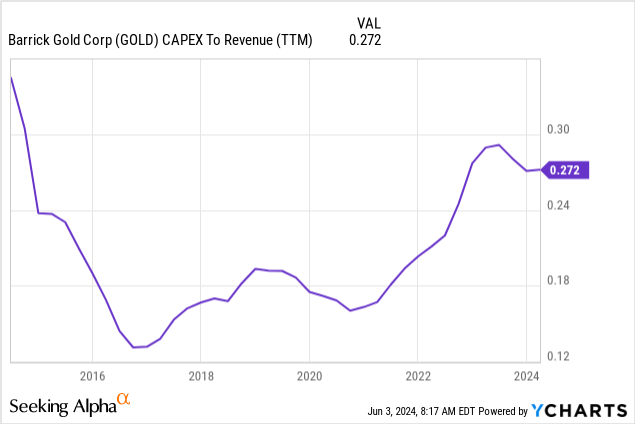
It appears that the only dimension where NEM has an advantage is its 136 million ounces gold reserves as of the end of 2023, compared to GOLD’s 77 million ounces. However, I do not consider it as big advantage given the massive gap in the operating efficiency demonstrated by the two companies. Moreover, Barrick is heavily focused on Tier One gold assets, which adds to the company’s efficiency as well. Out of the company’s total 13 gold mines, six are considered Tier One, which is a great concentration of high-quality assets. Moreover, the company reinvests about a quarter of its revenue in capex, which will likely help in expanding its asset base over the long term.
As my analysis shows, GOLD is a high-quality company delivering strong profitability and boasting a healthy financial position. Its excellence is underlined by comparison with a notably larger player, Newmont Corporation. GOLD’s fundamental strength and my bullish outlook is also supported by recent quarterly performance. The company topped expectations in Q1 2024 and the management reiterated its full-year production targets.
Seeking Alpha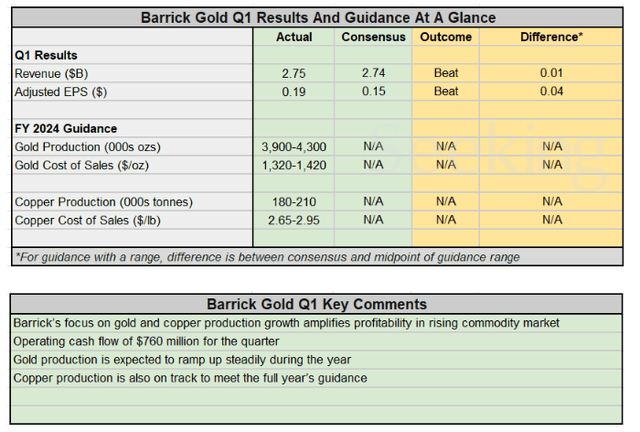
Any mining company’s financial performance is heavily dependent on commodity prices. Since Barrick’s revenue is mostly generated from gold, let us look at what is happening with gold prices.
goldprice.org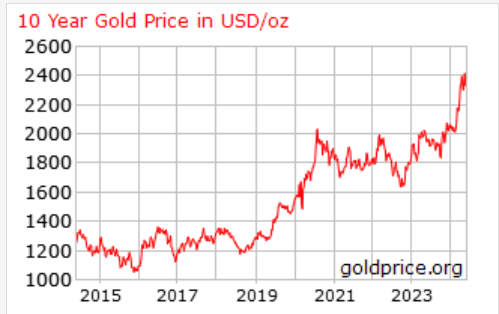
Gold prices are currently two times higher compared to the beginning of the past decade. Big disruptions which happened in the world over the last five years likely were the major reasons why the demand for gold soared: the COVID-19 pandemic, war in Ukraine, and the Israel-Hamas war.
While the pandemic is likely in the past, the situation around these two wars is getting more complex. For example, war in Ukraine has recently escalated to a new level after Joe Biden allowed Ukraine to hit some targets on Russian territory using the U.S. weapons. Germany and France will also likely give the permission to use weapons produced in these countries in the same way.
The Israel-Hamas conflict also appears to be far from resolution as recently Israel’s Prime Minster said that a permanent cease-fire in Gaza a “nonstarter” until long-standing conditions for ending the war are met.
In the other part of the world, China continues to maintain tension around Taiwan with its recent military drills around the island. Chinese Defense Minister Dong Jun even said that the country’s military was ready to “forcefully” stop Taiwan’s independence in his latest public speech.
Therefore, geopolitical situation in the world is getting more complicated every day and cease-fire is unlikely to happen in foreseeable future neither in Ukraine, nor in Gaza. These factors will likely keep the demand for gold elevated, since it is a defensive asset, and I believe Barrick will likely continue benefitting from this favorable trend.
Intrinsic value calculation
I want to finalize my head-to-head comparison of GOLD and NEM by looking at valuation metrics of these two companies. Despite being a much more profitable company with a notably healthier financial position, GOLD is cheaper when we compare valuation ratios. In the below table, none of GOLD’s valuation ratios is higher than NEM’s. To me, this indicates that the stock is attractively valued.
Seeking Alpha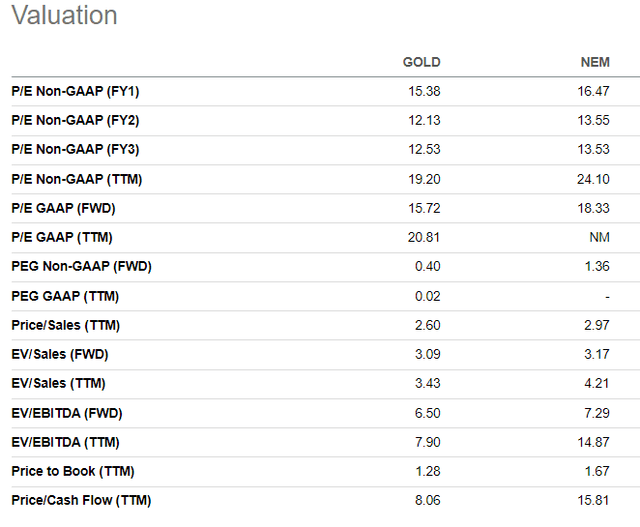
Discounting future dividends is another good way to understand valuation attractiveness. The stock’s intrinsic value will be calculated using the dividend discount model (DDM). The discount rate for this approach is the cost of equity, and its calculation is outlined below.
DT Invest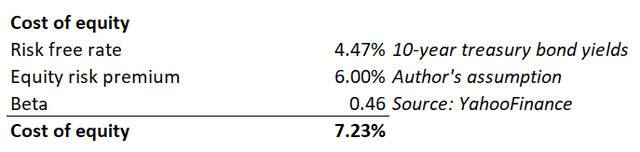
Cost of equity is 7.23%, and I will be deducting the expected growth rate from it in my DDM formula. GOLD’s last decade’s dividend CAGR is 7.18%, which is almost equal to the discount rate and that makes my DDM irrelevant. Therefore, I have to implement a more conservative dividend growth assumption and the last decade’s sector median 5.47% CAGR looks suitable. According to the dividend scorecard, forward annual payout is $0.4.
DT Invest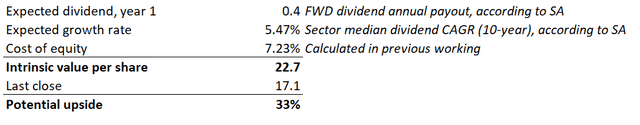
The potential upside is 33%, given the estimated intrinsic value of the stock is $22.7. Given robust fundamentals, a 33% discount is a real bargain.
What can go wrong with my thesis?
As I said earlier, gold is a defensive asset and the demand for it increases during uncertain times. There are two ongoing wars which made the geopolitical situation in the world extremely complicated. But history suggests that all wars end with peace. I am not a political or military expert, and I might be wrong in my assessment that these two wars are unlikely to end soon. I think that easing of geopolitical tensions might significantly soften demand for gold, which will work against my thesis.
Gold mining companies frequently expand their mine portfolios with multi-billion-dollar acquisitions. Large deals are inherently risky and expose companies to several legal and regulatory risks. Moreover, acquisition amounts are calculated using long-term projections and loads of assumptions, which might turn out to be excessively optimistic. Thus, there is always an elevated risk that GOLD might pay too much for a potential acquisition and this will not be beneficial for shareholders.
Summary
GOLD is a strong buying opportunity for investors seeking to benefit from the strong momentum in gold prices. The company demonstrates exceptional profitability, owns several Tier One assets, and has a strong financial foundation to continue investing in production expansion. The stock is also very attractively valued with a 33% potential upside.
Read the full article here