


Introduction
Prospective investors who are interested in value-oriented ETFs are spoilt for choice these days, with a multitude of options now on offer; within this wide universe, we have the S&P 500 Value ETF (NYSEARCA:SPYV), that focuses on stocks from the flagship benchmark that display the strongest value characteristics.
SPYV vs. VTV
To better understand SPYV’s qualities, we felt it would be fitting to measure it against the largest value ETF in the market – the Vanguard Value ETF (VTV).
Note that even though SPYV has been around for almost 4 years more than VTV, investors appear to have taken a strong liking to the latter; this can be seen in the explosion of its AUM, which currently stands at close to $165bn AUM, and is over 7.5x greater than SPYV’s corresponding AUM. Even as a trading vehicle, VTV tends to attract a lot more attention, and this is mirrored in the daily volumes seen in dollar terms, where we have a differential of over 3x between these two respective products.
So, what could explain VTV’s huge popularity relative to SPYV? Well, the oft-quoted theory with Vanguard-based products is that they are typically the cheapest within an ETF segment, but that reasoning doesn’t necessarily to be a key differentiator in this case, as even SPYV offers an identical expense ratio of just 0.04%.
Perhaps investors also appreciate the relative stability of VTV? Last year it churned only 10% of its total holdings, and the year before it was even lower at 5%. SPYV, on the other hand, is more prone to turning over its portfolio with a ratio of 27% which is more or less in line with the sector median rate.
Investors may also be attracted by VTV’s better income profile. For context over the last 3 years, it has been growing its dividend at a greater pace of almost 9%, relative to just a pace of low single digits for SPYV. This also means that VTV currently offers a yield that is almost 60bps better than our focus product. Its current yield is also not drastically lower than its 4-year average, whereas the variance for SPYV with its historical average is quite wide.
YCharts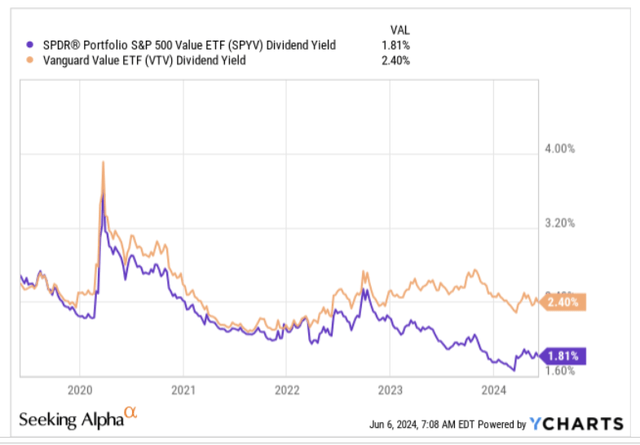
More than all this, we think VTV’s popularity could be explained by its more stringent screening methodology, which ends up in it pursuing a smaller pool of stocks (345 vs 442 for SPYV).
Whilst both products predominantly focus on large-cap value stocks (70% of SPYV’s portfolio and 73% of VTV’s portfolio), VTV uses a five-factor methodology to pick its stocks, whereas SPYV sticks to only 3. SPYV focuses on stocks that score highly from an earnings yield, sales yield, and book value to price basis. VTV uses those three metrics as well, but also supplements it further by incorporating a forward earnings yield, as well as a dividend yield. Crucially, whilst determining a composite value score VTV tilts more towards the book value to price ratios, as well as the historical and forward yields (the dividend yield and the sales yield only account for a third of the total score).
Seeking Alpha, ETF Prospectuses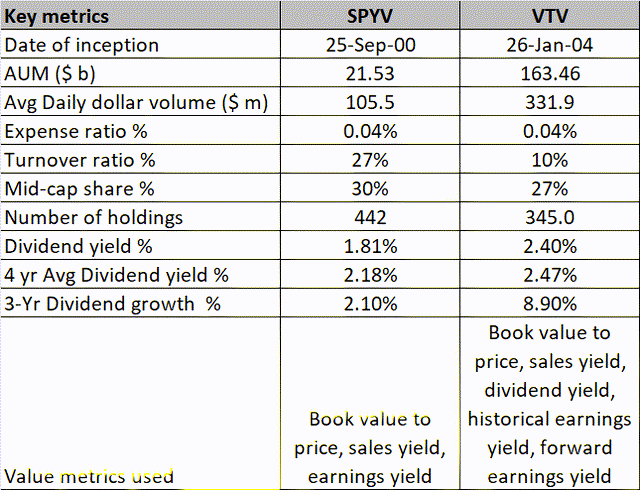
Does VTV’s larger factor methodology make a big difference? Well, the results are mixed. Note that since VTV’s listing date in 2004, it has managed to outperform SPYV by 1.11x, but if you bring the degree of risk involved into the equation, and look at it from different time periods, the end result is less clear.
YCharts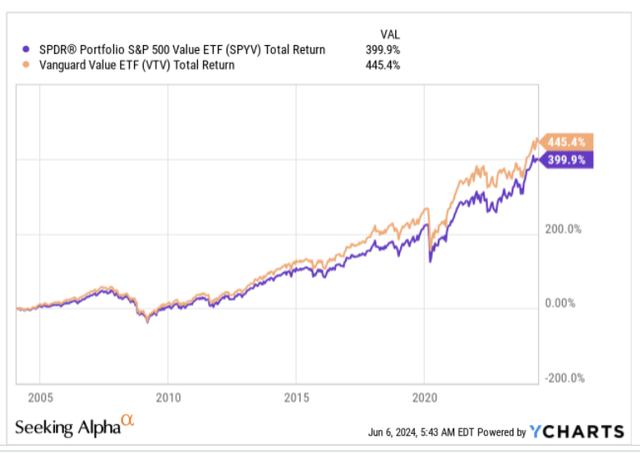
The Sharpe ratio considers how well these two products have done in generating returns over the risk-free rate after considering the total risk taken. Whilst VTV has done very well over a 15-year time frame, SPYV has come out on top, in the last 5 years.
YCharts YCharts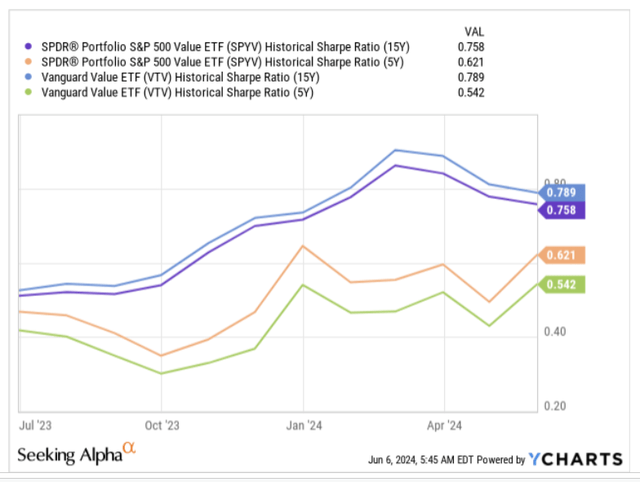
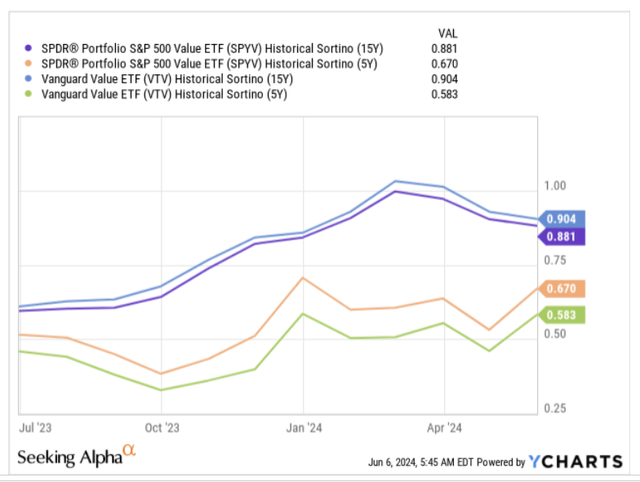
A similar outcome is seen when you view these products through the prism of the Sortino ratio, which measures excess return potential in the face of only harmful volatility. SPYV has a better short-term track record, but VTV has fared better over the last 15 years. Given these mixed results, it is fair to wonder if some of VTV’s additional screening factors are superfluous.
Closing Thoughts – Should You Buy SPYV Now?
Whilst SPYV stacks up pretty well against its larger peer (except from an income angle), we remain conflicted about whether a long position now would be too conducive. Here’s why.
SPYV is dominated by stocks from the financial sector, and here there are both good and bad things to consider. Given the Fed’s desire to maintain this higher-for-longer stance, a lot of people have been writing off the ability of banks to see ample loan appetite and the associated NII gains; whilst there may be pressure on the NII front, the other income side of the business has proven to be a positive surprise, and this has played a key role in seeing the financials sector fare very well in the recently concluded earnings season.
To expand on this, note that since the end of March, no other sector has managed to generate more positive revenue growth surprises than the financial sector.
Looking ahead, two-third of economists surveyed by a Reuters poll expect the Fed to cut rates in September, and that could be music to the ears of banks, given the challenging loan growth momentum. Also consider that for the FY, financials are poised to deliver solid enough earnings growth of 13%, with only the high-growth tech and communication services segments offering a better earnings outlook.
FactSet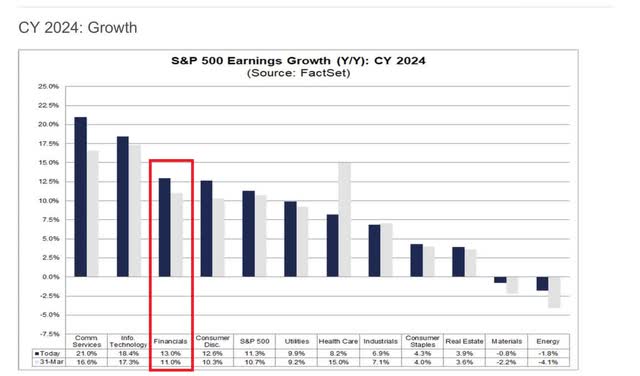
The chart below also suggests that within the S&P 500 universe, the financial sector looks like quite a beaten-down space, with its current relative strength ratio vs the index, only half as much as its long-term average. As a result, financials wouldn’t be a bad bet for some mean-reversion.
YCharts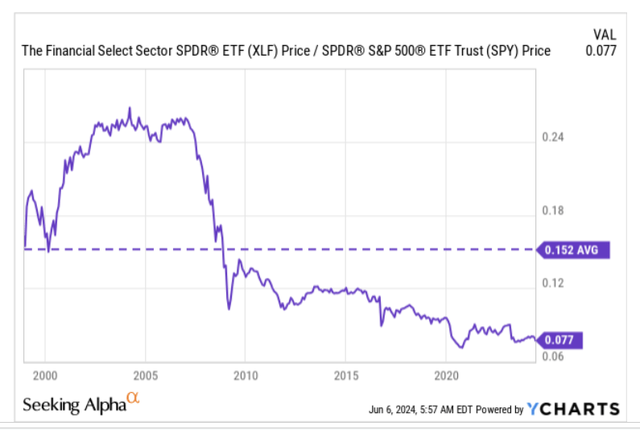
However, despite all that, investors may also want to note that the prospect of excess capital requirements for large banks may prevent them from fulfilling their true potential. The Basel III End game proposals will likely cause large banks to set aside more capital and cause them to withdraw from lending avenues such as mortgages, corporate loans, etc. This is still an evolving situation and banks will still have a three-year window from July 2025 to comply with the new framework, but it still feels like a crippling development.
FT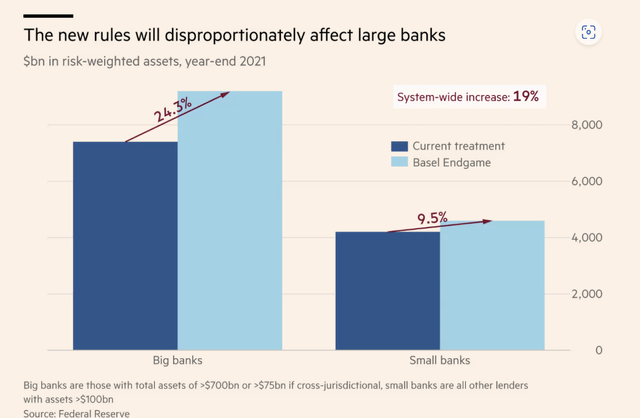
Finally, if we look at SPYV’s long-term chart, it’s difficult to get too excited about commencing a long position now, given where the price is currently perched. Note that for over two decades, SPYV trended up within the boundaries of an ascending channel; however, since the turn of the year, we’ve seen the ETF break past this range, and now it is now too far away from lifetime highs. We think investors ought to wait for a pullback to its old channel, before considering a long position. At these elevated levels, SPYV is a HOLD.
Trading View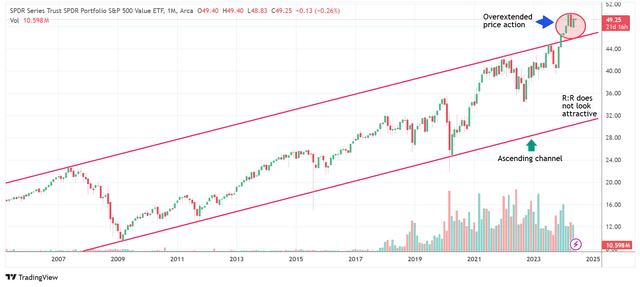
Read the full article here