


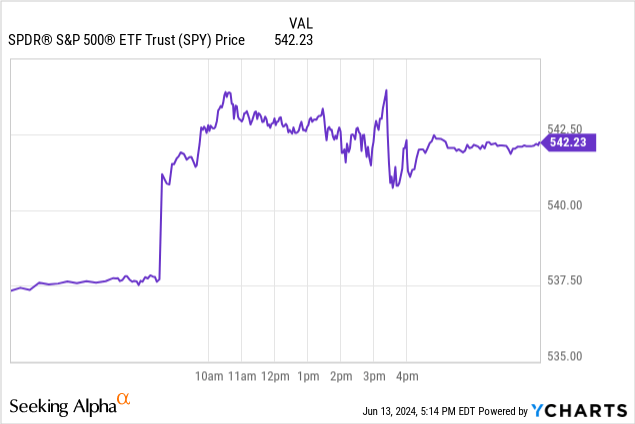
Last Wednesday was a quite busy day for the markets as we witnessed release of the monthly CPI report as well as Fed’s monthly rate decision followed by a speech by Jerome Powell on the same day. The market’s reaction was slightly positive but also mixed considering Dow (DIA) was red while S&P 500 (NYSEARCA:SPY) and Nasdaq (QQQ) were green but even they gave up much of their gains in the later part of the day. Prior to Powell’s speech SPY was up 1.4% but it ended the day being up “only” 0.8%.
The latest CPI report indicates a slight slowdown of the inflation with monthly inflation coming at 0.0% and annual number coming at 3.3% both slightly below analyst estimates. While this was better than analyst estimates and slight improvement over last month’s numbers, we are still significantly above the Fed’s long term target of 2.0%. In fact, the Fed’s target is not simply having inflation of 2.0% for one month but having a monthly average of 2.0% in the long run so we need multiple months at or near 2% before the Fed’s target is reached.
Meanwhile, labor market is also posting a mixed picture. Last week we saw unemployment rate rise to 4.0% even with the addition of 272k jobs which was significantly better than April’s 165k and analyst estimates of 182k. The reason unemployment rate rose was because labor participation rate rose which means more and more people started to look for a job. Interestingly enough, when we look under the hood we are seeing another trend where a great majority of job gains came from part-time jobs while the economy continued to lose full-time jobs.
As a matter of fact, if we include those who are holding part-time jobs but would have liked to have a full time job, unemployment rate rises to 7.4%. Moreover, during the month the economy lost about 625,000 full time jobs. To complicate matters even more, the average hourly earnings grew by 0.4% from last month.
As the numbers keep coming mixed, you hear people from both bulls and bears making arguments which might both make sense. For example, bulls say that inflation is dropping while the economy is still adding jobs which indicates that we are headed for what many people call a “soft landing”. Bulls also argue that corporate earnings are still growing and likely to accelerate soon with technological improvements such as additional utilization of AI. Meanwhile, bears indicate that the pace of the growth in the economy is slowing significantly while we are still significantly above Fed’s inflation target which means we could be headed for “stagflation” which is a term that comes from a combination of high inflation and low growth. Last month, Jerome Powell famously said “I don’t see the stag, or the ‘flation” and dismissed fears of stagflation but many people don’t agree.
The last big stagflation we experienced was in 1970s when we had both inflation and unemployment rate near or at double digits which was a scary period for many investors. Currently with inflation sitting at 3.3% and unemployment at 4.0%, we are not anywhere close to those scary numbers but things could easily shift.
Furthermore, bears also argue that valuations are sky-high and the entire market performance is driven by about 5-10 stocks. They argue that even if corporate earnings may be growing and AI might bring more prosperity for some companies, this is probably already priced in with S&P 500 trading at a P/E of 28. I’ve seen many different numbers referring to the P/E ratio of S&P 500 ranging from 20 to 30 and people wonder what the “true” P/E of the market is. This is because companies now report many different types of earnings when they report their quarterly and annual results including GAAP net income, non-GAAP net income, EBITDA, adjusted net income, adjusted operating earnings and so on which makes these calculations not only difficult but also difficult to compare against historical figures.
Historically speaking S&P 500’s long term average P/E stands around 16 but this is based on GAAP earnings. Today’s P/E ratio is 28 on GAAP basis and closer to 23 on non-GAAP or adjusted basis. Still, this doesn’t tell the full picture either because for long periods of time the index used to mostly consist of sectors such as industrials, financials and energy sector which tend to have low P/E ratios in general. Even today as S&P 500 trades at sky high valuations, those sectors still trade at low valuations but today’s index includes a mix that favors technology and growth companies which means we get a higher valuation overall. Some investors think this is not justified while others disagree. This is why it’s called a “market”. If everyone had the same opinions, we’d only have buyers or sellers and there wouldn’t be a market to speak of.
One thing I find highly unusual in today’s markets is not valuations but lack of volatility. Many people say today’s market looks exactly like the later parts of the dotcom bubble period (around 1998-2000) when markets performed exceptionally well. The funny thing is many people don’t remember how volatile those days were. We used to have daily swings of 1-2% on almost daily basis and markets were pretty wild. Today’s market looks very tame in comparison with VIX near all time lows at 12 and most days ending flat or slightly green.
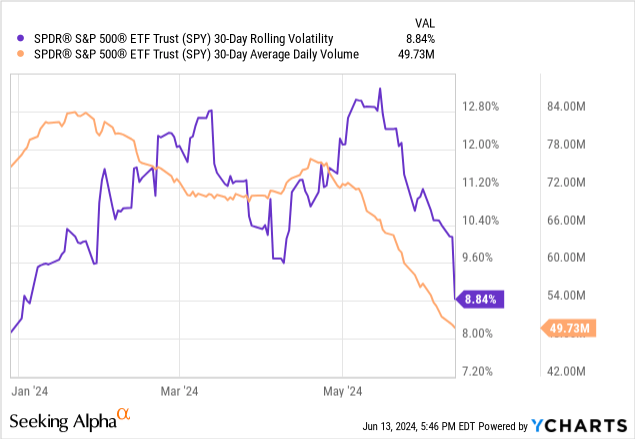
Here is an interesting stat. The last time S&P 500 dropped by -1% was in April which was almost 2 months ago, the last time the index dropped by -2% was in February of 2023 which was 16 months ago and the last time we saw a drop of -3% in the big index was in August of 2022 which was almost 2 years ago. Of the last 10 days where markets opened red, 8 ended in flat or green territory and 2 ended in slightly red territory. Currently SPY’s 30-day moving volatility is 8.84 which is even lower than the current VIX of 12. In other words, even near all time lows, the current VIX is still overestimating volatility by almost 50%. Not only that but volumes are very low too. SPY’s current average volume of 49.73 million is significantly below its normal range not to mention 80-84 million average from earlier this year.
So what’s going on? There is a lot of mixed data out there and this brings uncertainty. Normally uncertainty would lead to higher volatility and higher volume but this time it’s having the opposite effect. There are a few possible reasons for this. First, over the last few years market participants have been trained to buy the dip every single time. Markets dip, people buy the dip and they are rewarded every single time so a lot of people are conditioned to not only buy every dip but also not sell at dips as well. This results in lower volume and lower volatility.
Second, markets rose so much in recent years that many people are sitting on huge gains and they don’t want to create a taxable event by selling their stocks. This is similar to how no one wants to sell their homes because they bought it when mortgage rates were at 2-3% range and they don’t want to lose those mortgages. People don’t want to sell their winners and get a big tax bill so this is like having “golden handcuffs” so to speak.
Third, a lot of people are in a wait and see status as we speak. Since VIX has low option prices are cheap so people can simply buy puts and hedge their portfolio for low prices which reduces their motivation to panic sell. I am also in this camp where I bought some put options as insurance which was cheaper than selling my winners and getting a big tax bill. You can also buy out of money VIX calls to insure your portfolio in case of a black swan event.
Also this is an election year and it’s not untypical for election years to save most of their volatility for the second half of the year. We could still see increased volatility as election date draws closer and closer as it happened in 2008, 2012, 2016 and 2020. In almost every single case, volatility started to pick up after August which might happen again.
Then there is the argument that the market performance is entirely driven by a few stocks. This is usually an argument made by bears but it sounds more bullish than bearish to me because if the entire performance of the market is being driven by a few stocks that means a great majority of stocks are remaining at reasonable prices. This indicates that there could be many stocks with cheap valuations to pick from since only a few stocks seem to be in “bubble” territory.
Currently there are reasons to be bullish but there are also reasons to be cautious. Then again when was the last time the market only had bullish or bearish reasons working for it? Every time markets start rising bearish people list reasons why they shouldn’t and every time markets start dropping bullish people list reasons why things aren’t that bad.
On the bullish side, there is still plenty of liquidity to boost stock prices, rate cuts could be on the horizon, corporate earnings are still growing, buybacks are accelerating, soft landing might be achievable, the economy is still growing (though slower than before), AI revolution is accelerating which could result in productivity gains and the US is still attracting money from all over the world as the “place to be” in the eyes of global investors.
On the bearish side, valuations are stretched (at least on average even though there are still many cheap stocks out there), growth is slowing, there is global uncertainty, AI has yet to be monetized, population is aging, US government’s debt is growing at an alarming rate, inflation is still persistent, margins look like they might have peaked.
Personally, I remain invested in stocks but adding some hedges and insurance plays to my portfolio especially considering how cheap put options are right now because of historically low VIX.
Read the full article here