


John B. Sanfilippo & Son, Inc. (NASDAQ:JBSS) is a very well run branded foods company. Managers are properly incentivized to pursue shareholder interests, and they have done so, increasing the firm’s economic profitability, generating rising free cash flows, and improving the company’s capital efficiency. However, analysis shows that the company is slightly overvalued, missing out on a buy recommendation from me.
The Business Model
Sanfilippo is a leading processor and distributor of peanuts, pecans, cashews, walnuts, almonds and other nuts in the United States. These nuts are packaged under the company’s Fisher, Orchard Valley Harvest, Squirrel Brand and Southern Style Nuts brands and under private brands as well. The company also manufactures, processes, markets and distributes a number of food and snack products, such as peanut butter, almond butter, cashew butter, candy and confections, snack and trail mixes, nutrition bars, snack bites, sunflower kernels, dried fruit, corn snacks, chickpea snacks, sesame sticks and other sesame snack products under its own brand names and under private brands. In addition, since its acquisition of the Just the Cheese brand, it now also offers baked cheese snack products under its own and private label brands. As of the third quarter fiscal 2024 report, trail and snack mixes were the company’s most important product by revenue, followed by peanuts and peanut butter and snack bars and cashew and mixed nuts.
Source: 3Q 2024 Report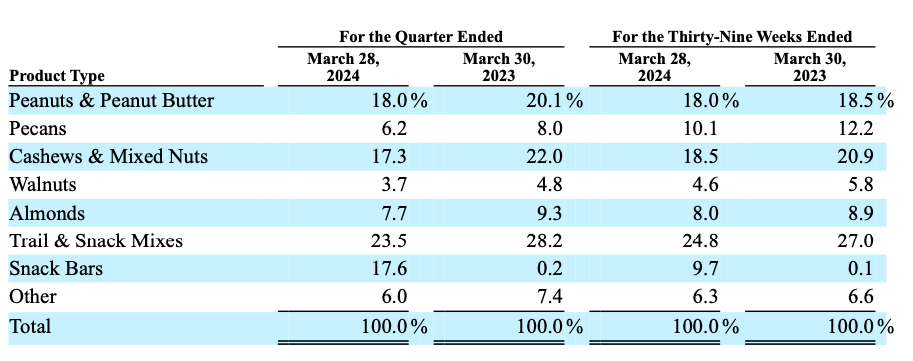
The company has three primary distribution channels: the consumer, consumer ingredient users and contract packaging customers channels. The consumer channel is easily the most important channel for the company, contributing 83.1% of revenues as of the third quarter of the fiscal year.
Source: 3Q 2024 Report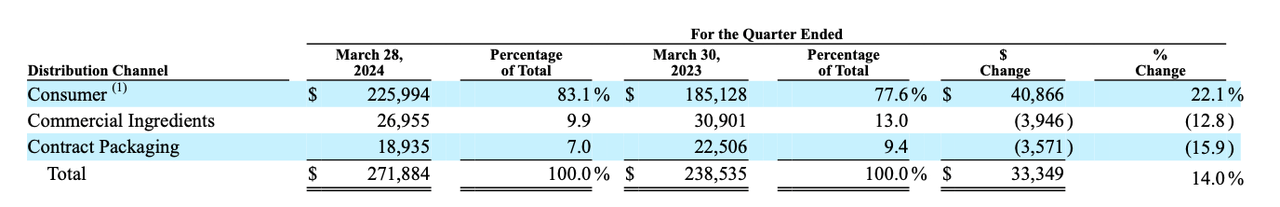
The consumer market comes with clear benefits: successful brands turn something that is undifferentiable, peanuts, into something that is differentiable and gives the company pricing power. Pricing power gives Sanfilippo a platform to improve NOPAT margins and protect itself against inflationary pressures from rising gold prices.
Executive Compensation Aligns Management and Shareholder Incentives
Agent-principal conflicts are rife in the stock markets. These conflicts arise where executive compensation does not incentivize management to work in the interests of its shareholders. Shareholder interests are advanced when economic profit is created. We know that economic profit is defined as:
Economic Profit = Return on invested capital (ROIC) – Cost of Capital (WACC).
This is mathematically equivalent to:
Economic Profit = Net Operating Profit After Tax (NOPAT) – Capital Charge
…where capital charge is equal to weighted average cost of capital times invested capital.
Sanfilippo’s Value Added Plan (SVA Plan), which is 30% to 40% of total compensation, successfully aligns management’s interests with those of shareholders. Management is given a cash payment based on the following formula:
Participant’s Salary = Participant’s Target Salary Percentage x SVA Improvement Multiple = SVA Payment Declared
According to Sanfilippo’s 2023 Proxy Statement:
“The SVA Plan rewards plan participants with cash incentive compensation for year-over-year improvement in economic profit. Economic profit is our net operating profit, as adjusted for share based compensation and net rental and miscellaneous expense, after taxes minus a charge for capital. The charge for capital is determined by multiplying the weighted average cost of capital (9%) by the invested capital in the business (adjusted net working capital plus net property, plant, and equipment and goodwill), excluding any excess cash and cash equivalents in excess of $2 million (such year-over-year improvement hereinafter referred to as “SVA”), as illustrated below:
SVA = NOPAT – 9% Capital Charge.”
Growth With Profitability
Since 2020, Sanfilippo has grown revenues from $880.09 million to $1.03 billion, compounding at 3.22% a year. In that time, Sanfilippo’s NOPAT has grown from $54.83 million in 2020 to $67 million in the trailing twelve months (TTM), compounding at 4.1% a year. To be clear, this is my measure of its NOPAT, which I derived by stripping away the impact of non-operating and non-recurring items, in the manner shown below:
|
Value in millions |
2020 |
2021 |
2022 |
2023 |
TTM |
|
GAAP Net Income |
$54.11 |
$59.74 |
$61.79 |
$62.86 |
$64.91 |
|
Total Net Non-Operating Expense Hidden in Operating Earnings |
$ (3.77) |
$ (5.02) |
$ (3.42) |
$ (1.37) |
$ (1.39) |
|
Reported Net Non-Operating Items |
$5.84 |
$5.36 |
$3.39 |
$4.87 |
$4.39 |
|
Change in Total Reserves |
$ – |
$ – |
$ – |
$ – |
$ – |
|
Implied Interest for Standardized of Operating & Variable Leases |
$0.19 |
$0.15 |
$0.10 |
$0.29 |
$0.33 |
|
Non-Operating Tax Adjustment |
$ (1.54) |
$ (1.39) |
$ (1.43) |
$ (1.66) |
$ (1.20) |
|
Net After-Tax Non-Operating Expense/(Income) |
$ – |
$ – |
$ – |
$ – |
$ – |
|
NOPAT |
$54.83 |
$58.84 |
$60.44 |
$65.00 |
$67.03 |
Source: Company filings and author calculations
This increase in NOPAT has been achieved thanks to rising NOPAT margins, which have gone from 6.23% in 2020 to 6.5% in the TTM.
A Free Cash Flow Machine
Since 2020, Sanfilippo has compounded free cash flows (FCF) at a rate of 15.51% a year, growing them from $41.76 million in 2020 to $85.87 million in the TTM. The total FCF the company has generated in that time is equal to $304.84 million, or around 27% of its market capitalization. Not only has the company generated enormous sums of FCF, that FCF is available at attractive levels, with a current FCF yield of 6.35%. In addition, cumulatively, the company has paid out 256.22 million in dividends in the last five years, well below the cumulative $304.81 million it generated in FCF. That demonstrates the safety of the dividends and implies room for increases in dividends paid.
Source: Company filings and author calculations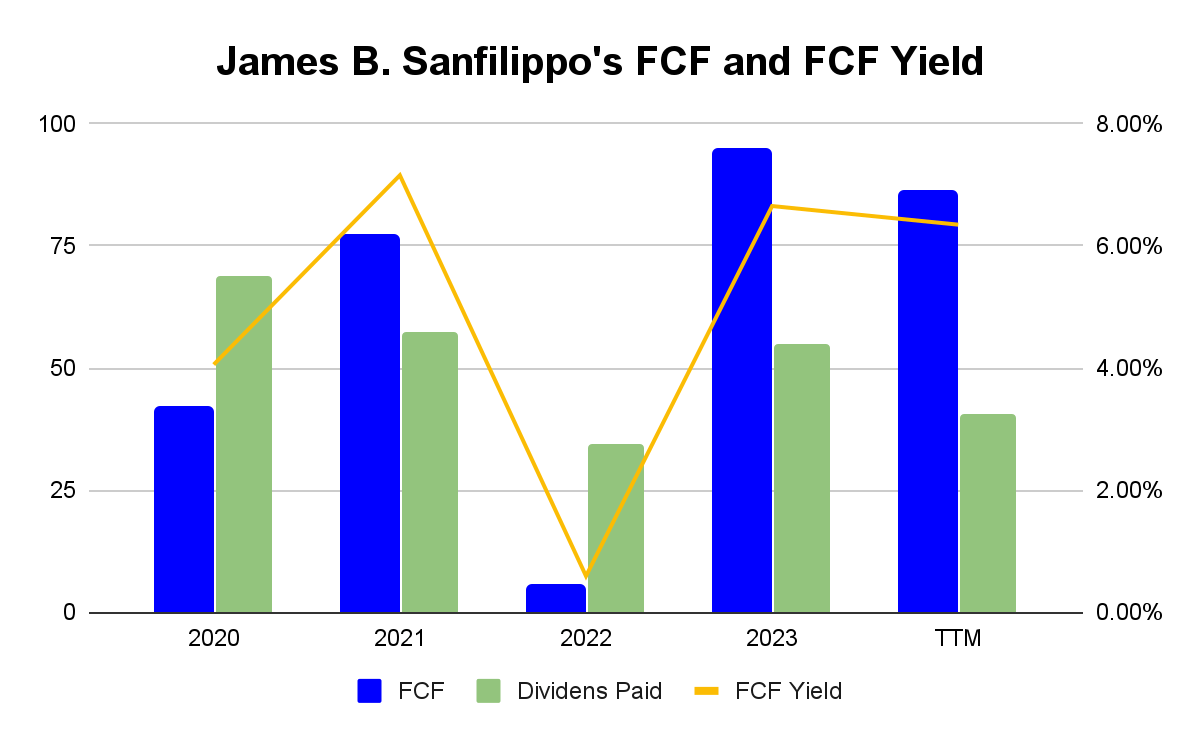
Capital Efficiency is Rising
ROIC has risen from 16.61% in 2020 to 17.69% in the TTM, which is further evidence of how the SVA Plan has aligned management with shareholder interests, and incentivized them to increase ROIC. Rising ROIC has been driven by improving invested capital turns, a measure of balance sheet efficiency calculated by dividing revenue by average invested capital. Invested capital turns have risen from 2.65 in 2020 to 2.72 in the TTM.
Sanfilippo is Slightly Overvalued
Sanfilippo’s intrinsic value, which can be estimated using Economic Book Value (EBV), a measure used by investment research firm, New Constructs, and which represents the pre-strategy value of the business, as seen in the table below:
|
Economic Category (Value in millions, except per share amounts) |
2020 |
2021 |
2022 |
2023 |
TTM |
|
NOPAT |
$54.83 |
$58.84 |
$60.44 |
$65.00 |
$67.03 |
|
WACC |
3.48% |
2.75% |
3.87% |
5.73% |
6.70% |
|
Excess Cash |
$ – |
$ – |
$ – |
$ – |
$ – |
|
Net Assets from Discontinued Operations |
$ – |
$ – |
$ – |
$ – |
$ – |
|
Net Deferred Tax Liability |
$ – |
$ – |
$ – |
$ – |
$ – |
|
Net Deferred Compensation Assets |
$ – |
$ – |
$ – |
$ – |
$ – |
|
Fair Value of Unconsolidated Subsidiary Assets (non-op) |
$ – |
$ – |
$ – |
$ – |
$ – |
|
Fair Value of Total Debt |
$56.05 |
$30.15 |
$55.87 |
$20.37 |
$54.71 |
|
Fair Value of Preferred Capital |
$ – |
$ – |
$ – |
$ – |
$ – |
|
Fair Value of Minority Interests |
$ – |
$ – |
$ – |
$ – |
$ – |
|
Value of Outstanding ESO After-Tax |
$ – |
$ – |
$ – |
$ – |
$ – |
|
Pensions Net Funded Status |
$ (32.20) |
$ (35.55) |
$ (29.51) |
$ (28.02) |
$ (28.02) |
|
Economic Book Value (EBV) |
$1,551.64 |
$2,145.18 |
$1,535.29 |
$1,141.99 |
$973.82 |
|
Split Adjusted Shares Outstanding (thousands) |
11,419.00 |
11,468.00 |
11,527.00 |
11,556.00 |
11,570.00 |
|
EBV per Share |
$135.88 |
$187.06 |
$133.19 |
$98.82 |
$84.17 |
|
Closing Stock Price |
$82.62 |
$88.40 |
$72.49 |
$119.36 |
$104.02 |
|
Price to Economic Book Value (PEBV) |
0.61 |
0.47 |
0.54 |
1.21 |
1.24 |
As you can see, with a share price of $96.54 at time of writing, Sanfilippo is trading at nearly 15% of its EBV, implying that the market expects a greater rate of economic profitability than is indicated by Sanfilippo’s current cash flows.
Conclusion
By any measure, Sanfilippo is a well run, profitable business whose managers are properly incentivized to pursue shareholder interests. Unfortunately, the market has caught up to this reality, and since 2023, the company has been trading at above its intrinsic value. I cap buy recommendations at a PEBV of 1.2, and Sanfilippo just misses out. For holders of the stock, I say, remain invested, but for everyone else, put Sanfilippo on your watch list.
Read the full article here