


I don’t mean to be flippant. I have invested in commodities through ETFs and stocks for a few decades. But as a 44-year chartist who uses technical analysis as the last but most important step in making any investment decision for my portfolio, I do see that despite a lot of up-and-down price action and hints of a long-awaited upside breakout, the status quo for the basket of commodities that is the Invesco Optimum Yield Diversified Commodity Strategy No K-1 ETF (NASDAQ:PDBC) is stagnation, and no clear direction. Even the name of the fund, a long way of saying “a basket of commodities without the hassles of a K-1 tax form,” is pretty boring.
But I digress. Let’s take a look at PDBC, which I have used as a go-to tactical commodities allocation perhaps six to eight different times since its 2014 inception, and see if there is something to get excited about.
About the asset class and the ETF (PDBC)
PDBC is one of several ETFs devoted to owning a diversified basket of commodities. Or more precisely, exposure to the performance of a basket of commodities. That’s because many of these ETFs invest in commodities through derivative contracts, and sometimes need to resort to using offshore subsidiaries to domicile the ETF. This was a big concern for ETF investors in past decades, and as nothing in investing is 100% certain, funds like PDBC has lasted a long time without major hiccups.
PDBC uses a Cayman Islands subsidiary, and has the somewhat unique feature of not being subject to issuance of a K-1 partnership tax form. I am not a tax advisor, so I’ll leave that aspect right there.
As PDBC’s documents state, it “invests directly, through derivatives, and through other funds in commodities. It invests in derivatives such as futures contracts on commodities, commodity-linked notes and on commodity indices, exchange-traded options on commodities futures, swaps on commodities, and commodity-related forward contracts to create its portfolio.”
Energy is the key driver of many commodities ETFs, and this one is no exception. It also allocates to precious metals, industrial metals, and agriculture commodities. At a time when inflation has burst back on the scene, spiked briefly and faded, but still has the potential to re-accelerate, investing in commodities might help offset some of that inflation risk. That’s because commodities are the raw input costs that makes many things we buy more expensive. In other words, commodity inflation is a big reason we have an elevated Consumer Price Index and Producer Price Index.
While the pandemic can be (and often is) blamed for a notable chunk of the inflation problem investors have dealt with for the first time in decades, the more time that passes since that 2020 event, the more inflation can potentially get “sticky” and weigh on consumer sentiment. More on that in a moment.
Holdings analysis
When analyzing any ETF, but especially those that focus on commodities and/or use derivatives, the ETF business is notorious (to me, at least) for providing irrelevant and insufficient holdings to big data distributors. Case in point, this holdings list from Seeking Alpha on PDBC:
Seeking Alpha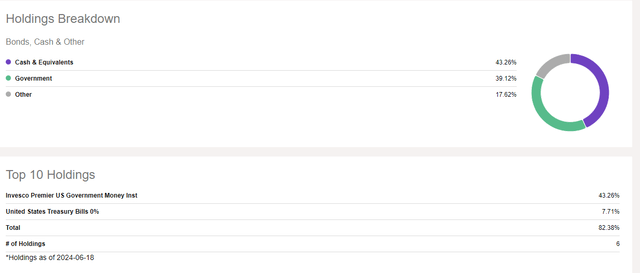
This has nothing to do with Seeking Alpha, who is just passing through the information/data received. So I have gotten into the habit of going to Invesco.com, looking up the ETF and reviewing this table regularly. It shows that four different varieties of energy are the four top holdings by weight, followed by gold and other precious metals, and several agricultural commodities such as corn and wheat. To me, this table is “gold” (pardon the pun) in understanding what I’m buying when I do own PDBC. That mix doesn’t change dramatically over time since it follows an index, and so it should be noted that PDBC can be simplified as an ETF that devotes half of its portfolio to energy and about 25% each to metals and agricultural items.
This is critical in my decision-making because there are now so many commodity ETFs that tilt the energy versus others in different ways, as well as ETFs that track most of those underlying commodities individually. So depending on what I see in my chart work, fundamental and quantitative analysis at any point in time, I may use PDBC alone, in tandem with other commodity ETFs, or, as is the case currently, not at all. But it is always on my list of “go-to” ETFs should conditions change.
Invesco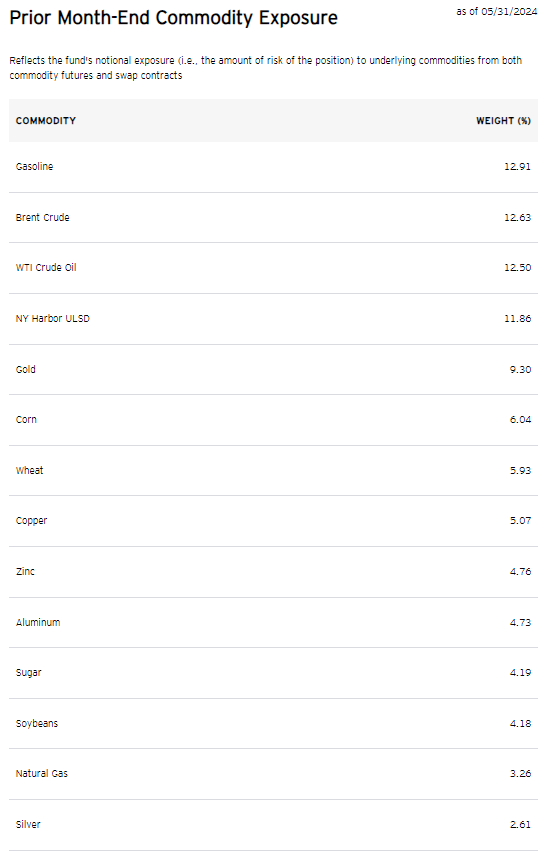
This additional detail from Invesco’s site shows how PDBC is built, down to the dollar amount. US T-bills act as the collateral and the specific derivative contracts are itemized, including expiration dates.
Invesco (downloaded and reformatted by Sungarden Investment Publishing / Rob Isbitts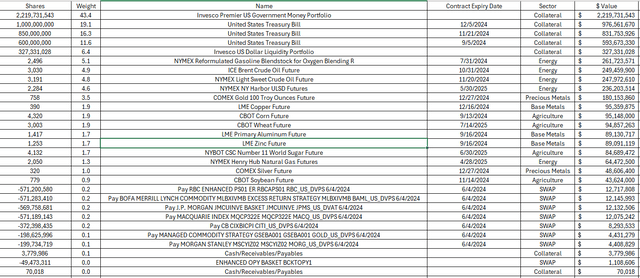
This is a terrific feature of this ETF versus funds like the very popular JP Morgan Equity Premium Income ETF (JEPI), which as I have written in the past, provides a decent amount of information about the specifics of its contracts, but as of the last time I investigated (earlier this year), did not disclose certain details such as counterparties, exact expiration dates and contract price/strike levels. Obviously that lack of full disclosure has not impacted JEPI’s ability to gather assets. But to me, transparency is one of the biggest advantages ETFs have over mutual funds.
Peer comparison
PDBC is the asset leader versus this set of competitors, and by a wide margin. That has a lot to do with a low expense ratio and the “K-1 free” aspect of this ETF. USCI has performed well at times versus PDBC, and that is because it is less oil-heavy than PDBC is.
Seeking Alpha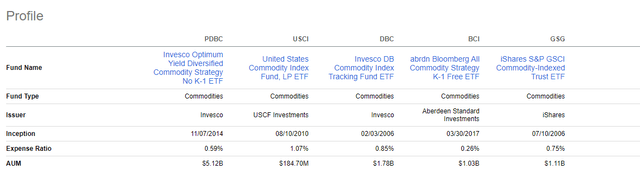
As noted earlier, PDBC is an ETF I find to be a good solid basic mix of 50%/25%/25% to the three major commodity areas. Beyond that core role, there certainly are other consideration in this part of the ETF market.
Performance trends in commodities
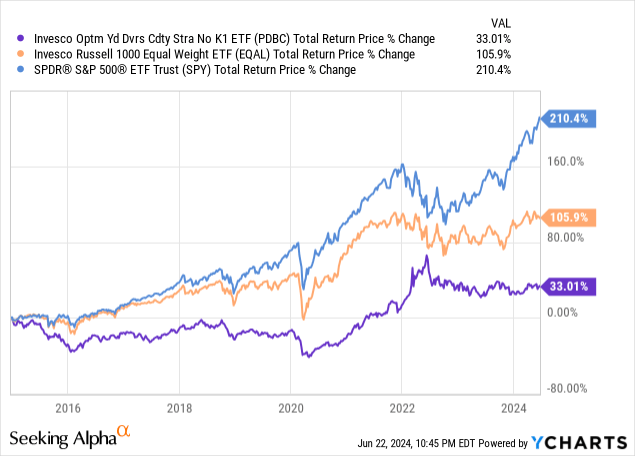
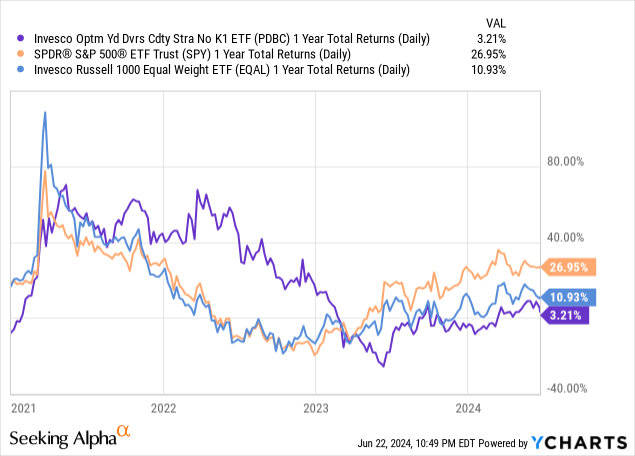
The chart above shows that since PDBC’s inception back in 2015, it has lagged far behind the S&P 500 and even the average of the top 1000 stocks. However, as shown below, if we go back to the period when inflation was starting to percolate in the lead up to 11 Fed rate cuts, that period from the start of 2021 through the end of 2022 shows how commodities can act as a nice diversifier to equity-heavy portfolio allocations. These are one-year rolling periods.
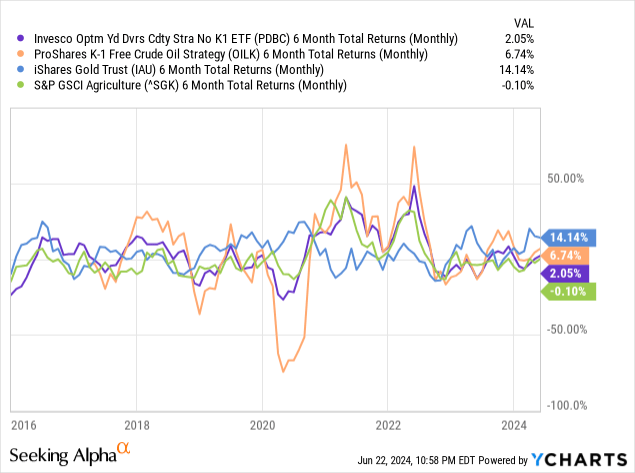
And, here’s a look at six-month rolling periods comparing PDBC to ETFs or indexes that track oil, gold and agriculture. The bottom line here is that PDBC can provide two benefits: smoothing out the inherent volatility of energy prices, and making up for weak periods in some segments of the commodities area. In other words, PDBC does its job, albeit with the diversification level somewhat tilted toward energy with that 50% allocation.
Still, this provides investors with a lot of ways to work around that “core” PDBC position, especially if unlike me, an investor wants to have a commodities position at all times, and also tactically manage around that by adding solo ETF positions in oil, gold, corn, etc. That is how I look at PDBC, as part of a total commodities exposure at any point in time. However, there are times like right now where my commodity exposure in “basket” form is zero. Instead, I tactically allocate to oil stocks, gold ETFs, gold mining stocks, etc. At this point, my allocation to commodities in total is toward the low end of what I consider “normal” for me.
Technical chart and conclusions on PDBC
Lastly, here is a chart that not long ago provided me with some optimism that PDBC would make its way out of the downward price trend marked by that black line, one that has enveloped this space since around this time two years ago, and appeared to be breaking out. But alas, oil and gold have, at least for now, flattened out, and agricultural commodity prices have not picked up the slack.
TC2000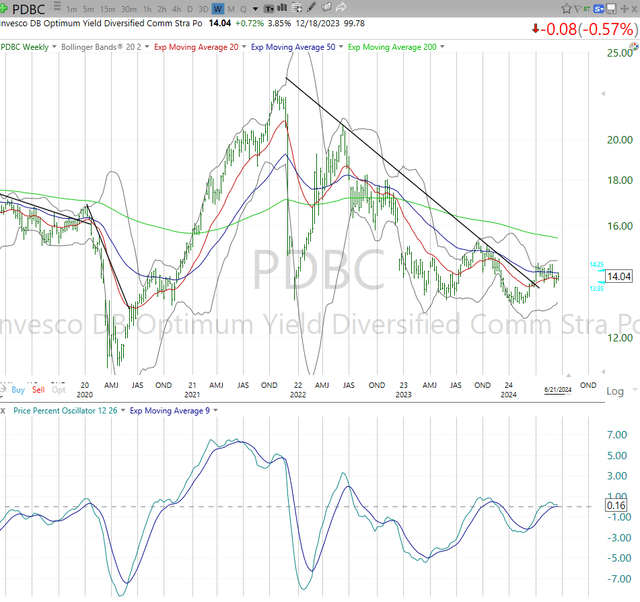
I am still looking closely for signs this changes and commodities get less “boring” and I feel I can take at least a starter position in PDBC and/or other commodity ETFs. But I find that the current equity market, long and short in different places, and at the individual stock level in some instances, are more intriguing to me currently. And of course, there’s the continued “gift” of 5% T-bill yields.
I continue to track PDBC and like it for its structure and transparency. But for now I rate it a hold, simply to represent that it looks neither ready to bust out to the upside, nor ready to break down through the $13 level, which has been a point in the past where it did get much riskier to own.
Read the full article here