


Editor’s note: Seeking Alpha is proud to welcome Delta Dividends as a new contributing analyst. You can become one too! Share your best investment idea by submitting your article for review to our editors. Get published, earn money, and unlock exclusive SA Premium access. Click here to find out more »
Choices for Dividend Growth
Dividend growth investors value companies with a history of consistent and increasing payouts, offering a growing income stream while minimizing the need to sell shares. The compounding effect of reinvesting dividends significantly accelerates portfolio growth, especially when paired with long-term capital appreciation. With three-quarters of S&P 500 companies paying dividends and hundreds of ETFs (yes, hundreds) that center on dividends, it can be challenging to identify the best of the best.
In Financials alone, there are dozens of dividend-paying companies with a Quant or SA analyst rating of “Strong Buy” – more than one would want in their portfolio from a single sector. Rather than pick stocks, some investors turn to dividend ETFs, the four largest by AUM being Vanguard Dividend Appreciation Index Fund ETF Shares (VIG), Vanguard High Dividend Yield Index Fund ETF Shares (VYM), Schwab U.S. Dividend Equity ETF™ (SCHD), and iShares Core Dividend Growth ETF (DGRO). All at once, this offers exposure to a broad range of businesses such as Exxon Mobil (XOM), Microsoft (MSFT), and Home Depot (HD). But, one also gains exposure all at once to companies with weak fundamentals. The much-lauded methodology of SCHD chose Leggett & Platt (LEG) and Newmont Corporation (NEM), for instance, both of which slashed their dividend in 2024. VYM holds Cisco (CSCO) and Verizon (VZ) in its top twenty, both of which have sported a negative total return over the past five years. While diversification can reduce risk, it can also limit the potential for outsized returns.
This leaves dividend growth investors with essentially three choices:
- Buy ETFs and take the good with the bad.
- Build a smaller, selective portfolio and aim for higher returns.
- Blend the two, complementing core ETF holdings with individual stocks.
I find option #1 least attractive but recommend it for those without the time or interest for stock picking. Options #2 and #3 may require more research, but investors dedicated to the process can strike a better balance of quality, risk, and reward.
With this in mind, I will share a simple screening process for identifying high-quality dividend payers and then assessing fundamentals for long-term compounding potential. Just eight companies in the Financials sector meet all my screening criteria, from which I will highlight one Elite Performer: Mastercard (MA) and one Elite Value: East West Bancorp (EWBC).
Screening for the Best in Financials
The Financials sector includes 682 companies in various sub-industries: banks, insurance, investment firms, payment processors, data providers, and so on. Just over two-thirds (465) pay a dividend, which by percentage ranks just behind Utilities at #1 and REITs at #2. To identify high-quality, long-term compounders, I start by applying eight filters in Seeking Alpha’s stock screener tool:
- Years of increasing dividends – minimum five years of growth
- Five-year dividend growth rate – minimum CAGR of 5%
- Dividend Yield – minimum 0.5%
- Dividend Payout ratio – maximum 60%
- Five-year revenue growth – minimum CAGR of 5%
- Three-year EPS growth – minimum CAGR of 5%
- Overall Quant rating – minimum 2.5 (Hold)
- Market cap – minimum $5 billion
Valuation is not considered at this stage as the goal is to identify what to invest in, not when. Applying these eight filters reduces the pool of dividend payers from 465 down to 23:
Data as of June 28, 2024 (Seeking Alpha)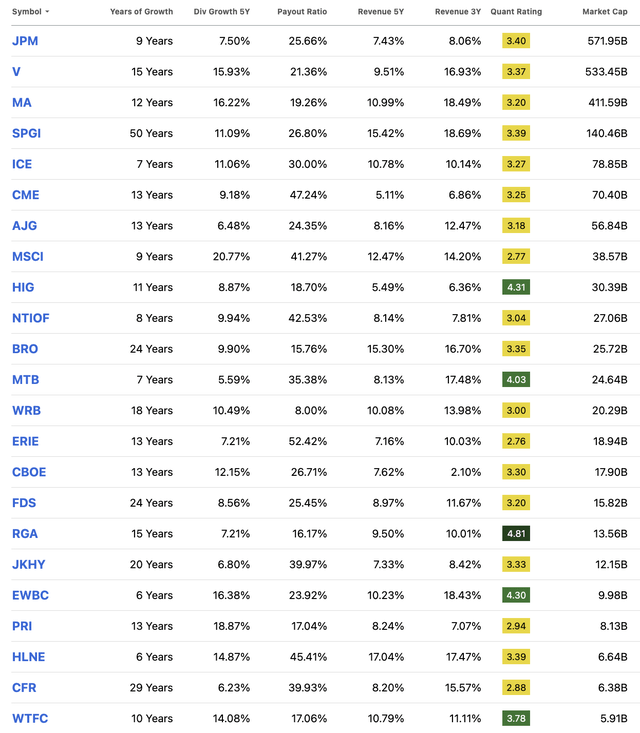
It’s a solid list, but most investors are not going to buy and then actively monitor this many businesses from each sector. To further narrow the field, I remove companies not traded on a U.S. exchange, here only National Bank of Canada (OTCPK:NTIOF), and then apply two additional criteria:
- Levered free cash flow (LFCF) – minimum 3-year CAGR of 5%; if unavailable, then FCF/share
- Return on Capital Employed (ROCE) – stable and increasing over time, and above the industry average; if unavailable, then Return on Equity (ROE).
Adding these criteria eliminates the following:
- S&P Global (SPGI) – declining FCF
- Arthur J. Gallagher (AJG) – below average ROCE
- Brown and Brown (BRO) – relatively low FCF CAGR
- M&T Bank (MTB) – industry-average ROCE/E
- CBOE Global Markets (CBOE) – relatively low FCF CAGR
- FactSet Research Systems (FDS) – declining ROCE/E
- Reinsurance Group of America (RGA) – inconsistent FCF, below-average ROCE
- Hamilton Lane (HLNE) – inconsistent FCF, declining ROCE
- Cullen/Frost Bankers (CFR) – inconsistent FCF
- Wintrust Financial (WTFC) – industry-average ROCE
Finally, I look at the forward dividend yield and the five-year dividend CAGR (1) as a point of comparison between businesses in the same industry, and (2) to spot any outliers.
| Fwd Yield | 5-Year CAGR | |
| (JPM) | 2.36% | 7.5% |
| (V) | 0.77% | 15.93% |
| (MA) | 0.59% | 16.22% |
| (ICE) | 1.32% | 11.06% |
| (CME) | 2.34% | 9.18% |
| (MSCI) | 1.32% | 20.77% |
| (HIG) | 1.86% | 8.87% |
| (WRB) | 0.60% | 10.49% |
| (ERIE) | 1.41% | 7.21% |
| (JKHY) | 1.33% | 6.8% |
| (EWBC) | 3.11% | 16.38% |
| (PRI) | 1.32% | 18.87% |
Based on this, I eliminate Intercontinental Exchange (ICE), W. R. Berkley Corporation (WRB), Erie Indemnity Company (ERIE), and Jack Henry & Associates (JKHY), as they lag their industry peers. This leaves eight of the “best” dividend-paying companies:
- Diversified Banks – JPMorgan Chase (JPM)
- Regional Banks – (EWBC)
- Transaction and Payment Processing – Visa (V), (MA)
- Financial Exchanges and Data – CME Group (CME), MSCI Inc. (MSCI)
- Life and Health Insurance – Primerica (PRI)
- Property and Casualty Insurance – Hartford Financial Services (HIG)
I will highlight two from this group: one of the best dividend growers over the past decade and a lesser-known regional bank that is trading at a historically favorable valuation.
Elite Performance: Mastercard (MA)
Mastercard, like Visa, enjoys a formidable moat. As Seeking Alpha analysts have already discussed this at length, I will just summarize: both are global brands known for their security and reliability, both spend strategically on acquisitions and capex, and both make significant investments in emerging technologies, such as digital wallets and contactless payments. Their highly efficient business model sets them apart from other Financials; as transaction processors, they earn fees on every swipe, tap, and click, resulting in some of the highest operating margins in the S&P 500. Moreover, the broader payments industry is expanding rapidly, as Rob Barnett recently detailed, particularly in developing economies where cashless transactions are growing at a high rate.
While Visa is an excellent company in its own right, Mastercard has the edge in the following:
| Mastercard | Visa | |
| Market Cap Growth (since 2019) | 57.6% | 47.0% |
| Revenue (5-year CAGR) | 11.0% | 9.5% |
| EPS (3-year CAGR) | 24.5% | 22.7% |
| EBITDA (3-year CAGR) | 21.7% | 13.4% |
| EBITDA (forward) | 18.1% | 12.9% |
| Current Ratio | 1.09 | 1.40 |
| Quick Ratio | 0.70 | 1.00 |
| Debt/Free Cash Flow | 3.19 | 3.26 |
Mastercard does compare less favorably to Visa by several valuation metrics. Both its trailing and forward P/E (GAAP) are higher, though Mastercard’s trailing PEG is slightly lower than Visa’s at 1.40 and 1.58 respectively. Mastercard’s EV/EBITDA (forward) of 25.14 also suggests a higher valuation than Visa, which sits just below 22. Despite a Quant Rating of F for valuation, Mastercard looks reasonably priced relative to its own five-year averages:
| Current | 5-Year Average | Difference | |
| P/E GAAP (trailing) | 36.4 | 41.4 | -12.6% |
| P/E Non-GAAP (trailing) | 35.8 | 41.0 | -12.6% |
| EV/EBITDA (forward) | 25.3 | 28.8 | -12.4% |
| Dividend Yield | 0.58% | 0.52% | +11.5% |
Wall Street analysts have an average price target of $513, but DCF valuations come in well below at around $320. Given that both Mastercard and Visa historically trade at a premium, at today’s earnings, I am looking to add to my existing position in Mastercard at a share price around $440 and have it currently as a Hold.
Elite Value: East West Bancorp (EWBC)
With a market cap at $10 billion, East West Bancorp is the sixth largest regional bank in the U.S. after Truist Financial (TFC), M&T Bank (MTB), Huntington Bancshares (HBAN), Regions Financial (RF), and Citizens Financial (CFG). East West Bancorp operates more than 120 branches, including five in mainland China and Hong Kong, positioning it as a financial bridge in China-U.S. business relations. This dual expertise helps them cater to the needs of U.S.-based clients looking to expand across the Pacific.
Among the eight largest regional banks, East West shows particular strength in the following areas:
- Tier 1 Capital Ratio of 12.87 – ranked #1
- Core Deposits to Loans Ratio of 126% – ranked #1
- Revenue (5-year CAGR) of 10.2% – ranked #3
- Revenue Per Share of 5.3 – ranked #2
- EPS (3-year CAGR) of 21.6% – ranked #1
- ROE of 16.9% – ranked #1
- ROA of 1.95% – ranked #1
- Net Income Margin of 48.1% – ranked #1
- Net Interest Margin of 3.1 – ranked #3
- Total debt of 3.7B – next lowest 4.7B
East West currently has a Quant Rating of C+ for valuation, among the worst of its immediate peers, but nonetheless looks reasonably priced relative to its own five-year averages:
|
Current |
5-Year Average |
Difference |
|
|
P/B (trailing) |
1.44 |
1.52 |
-5.3% |
|
P/B (forward) |
1.33 |
1.42 |
-6.3 |
|
P/Cash Flow (trailing) |
6.9 |
8.0 |
-13.8% |
|
Dividend Yield |
2.83% |
2.44% |
+15.7% |
The average price target among Wall Street analysts is $88.60 (DCF valuations range widely and are generally less reliable for banks). Based on the above, I would be comfortable initiating or adding to a position up to $76, about $3 above the current stock price, and rate East West a Buy.
Know What You Own
Parting words for ETF holders: keep in mind that Financials are weighted quite heavily in the largest dividend-focused ETFs:
As of June 24, 2024:
| AUM | In the ETF’s Top 15 | Sector Weighting | Sector Rank | |
| (VIG) | 92.7B | (JPM), (V), (MA) | 20.8% | #2 (after Tech) |
| (VYM) | 67.2B | (JPM), (BAC), (WFC) | 20.5% | #1 |
| (SCHD) | 54.0B | (BLK) | 16.9% | #1 |
| (DGRO) | 27.0B | (JPM), (BAC) | 18.7% | #1 |
If you own any of these (or others), you should know what companies you’re already invested in. You might wish to increase the weighting of these companies or steer clear.
Read the full article here