

VTI ETF: why we prefer it over SP500
In my last article on the Vanguard Total Stock Market Index Fund ETF Shares (NYSEARCA:VTI) (see the screenshot below), I analyzed the key reasons why I liked this total market fund better than funds indexed to the S&P 500 (SP500). The top reasons are valuation discount and growth potential, as summarized below:
The Vanguard Total Stock Market ETF offers advantages over the S&P 500 index due to its inclusion of mid and small-cap companies. The inclusion of mid and small-cap companies can provide exposure to higher growth potential at a much more reasonable valuation (even slightly discounted compared to the average in the past few years) compared to the S&P 500 index.
Seeking Alpha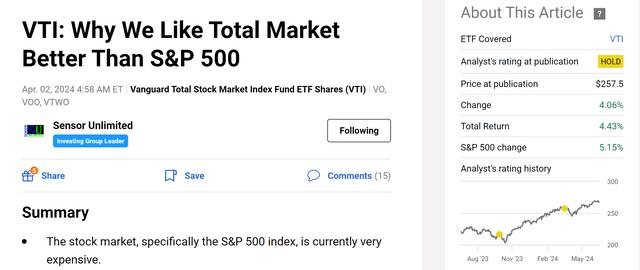
In this article, I will provide two more thoughts based on the new developments since my last writing. These new developments are my updated outlook for interest rates and the updated valuation metrics given the price changes. As you will see, after analyzing the potential impacts of these changes, my conclusion is that VTI is still preferred over funds based on the SP500.
VTI ETF: the differences and why they matter
As a popular total market fund, VTI needs little introduction. So here I will just point out a few key differences that are directly relevant to the remainder of the discussion. The chart below summarizes the key features of the VTI funds compared to its peers such as Vanguard S&P 500 ETF (VOO), Vanguard S&P Mid-Cap 400 Index Fund ETF Shares (IVOO), and Vanguard S&P Small-Cap 600 Index Fund ETF Shares (VIOO). As seen, all ETFs have the same low expense ratio of 0.03%, a hallmark of Vanguard funds. The key difference is in the number of holdings. VTI tracks the total stock market, so it holds the most stocks (over 3,500) compared to the others which track a specific segment of the market (~500 for VOO, ~400 for IVOO, and ~600 for VIOO).
Vanguard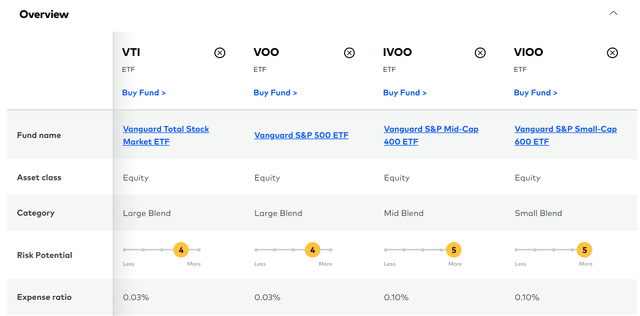
A key consequence of such different holdings is lower valuation risks in my mind. As argued in my earlier article, mid and small-cap companies were trading at a much more reasonable valuation than large caps yet offering similar (or even better) growth potential.
Since my last writing, SP500’s price has advanced even more than VTI (5.15% vs. 4.06% if you recall from the first chart above). It is bad news for VTI holders (such as me) that its performance dragged. However, looking ahead, such a price divergence further widened the valuation gap and made VTI’s valuation even more attractive. More specifically, the chart below summarizes the valuation metrics of VTI compared to VOO (and IVOO and VIOO too). As seen, in terms of P/E ratio, VTI’s P/E ratio of 25.1x is noticeably lower than VOO’s 26.1x. The root reason for such lower P/E is the attractive valuation ratio of the mid- and small-cap stock: IVOO has a P/E ratio of 18.2x and VIOO has a P/E ratio of 15.2x only. P/B ratios paint the same picture as seen.
Next, I will explain why a potential rate cut could benefit VTI more than VOO.
Vanguard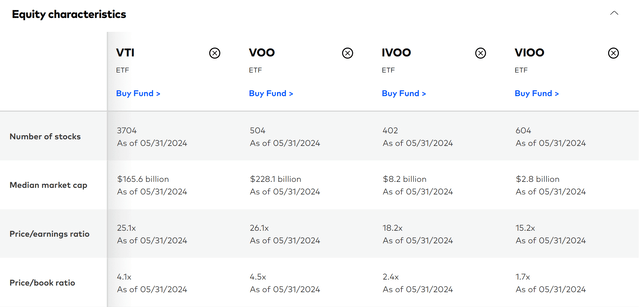
VTI ETF: potential impacts from a rate cut (or cuts)
Since my last writing, another key development involves the new CPI data (which was milder than before) and the new interest rate outlook. As illustrated by the chart below, the market expectations now imply much larger odds for rate cuts by 2024. To wit, my key observations from the following data provided by the CME Group FedWatch Tool are:
- The current expectation implies the chance for rates to stay in the current range of 5.25% – 5.50% is much lower. The chance used to be 15% a month ago and now is only about 5%.
- According to federal funds’ futures contracts monitored by this tool, there is a dominant chance for rates to drop by at least 25 basis points. As just mentioned, the current expectation implies only a 5% chance for rates to remain put. In other words, there is a 95% chance for a rate cut (27% chance for a cut of 25 basis points and 68% chance for a cut of more than 25 basis points).
CME group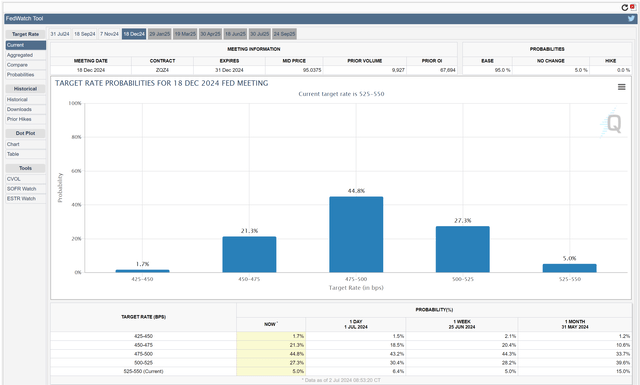
Of course, a rate cut most likely will benefit all equity funds and not only VTI. However, my view is that the stock prices of mid- and small-cap stocks can rise more than large caps in the case of a rate cut, thus leading to an outperformance for VTI. Mid- and small-size businesses typically rely more on borrowing money to fund their operations compared to large, established companies. This makes them more sensitive to interest rates.
When rates are cut, the cost of borrowing goes down, freeing up capital for small companies to invest in growth and potentially increasing their profitability. This can make their stocks more attractive to investors, driving their prices up more drastically. Furthermore, mid- and small-cap companies generally tend to have higher growth potential than large-cap companies. A rate cut often signals a stronger economic environment and more favorable conditions for these smaller businesses to expand, leading to a larger price increase.
Other risks and final thoughts
In terms of downside risks, as an index fund, VTI is heavily influenced by the overall economic conditions of the United States just like other market funds (and such influence is often called a systematic risk). Even though VTI offers broader diversification across the US stock market, the systematic risk that is inherent to the market can’t be eliminated through diversification.
A second risk is valuation risk. The point I want to make in the second section is that VTI offers lower valuation risks relative to SP500, and the operative word is relative. VTI itself is expensively valued by historical standards. As an example, the chart below shows its valuation in terms of dividend yield. As seen, VTI’s current dividend yield of 1.37% is significantly below its historical average of 1.68% in the past decade. Moreover, the current yield is also among the lowest levels in the past 10 years.
Seeking Alpha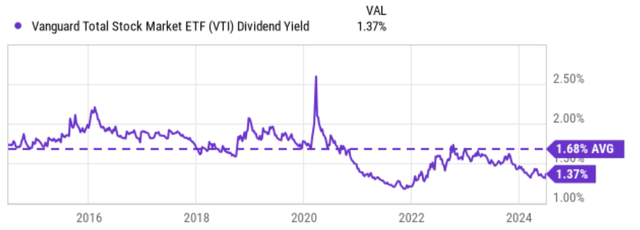
All told, my conclusion is that VTI offers a better return/risk ratio compared to large-cap funds such as those indexed to the S&P 500. The top factors are the lower valuation risk and higher potential benefit in the case of a rate cut (which is a very likely scenario according to the updated market expectation). Finally, I do put my money where my mouth is. The chart below shows the current holding in my growth account (which follows a so-called barbell model, as detailed in our blog article). As seen, VTI is a core and large holding, representing almost 17.5% of the account.
Author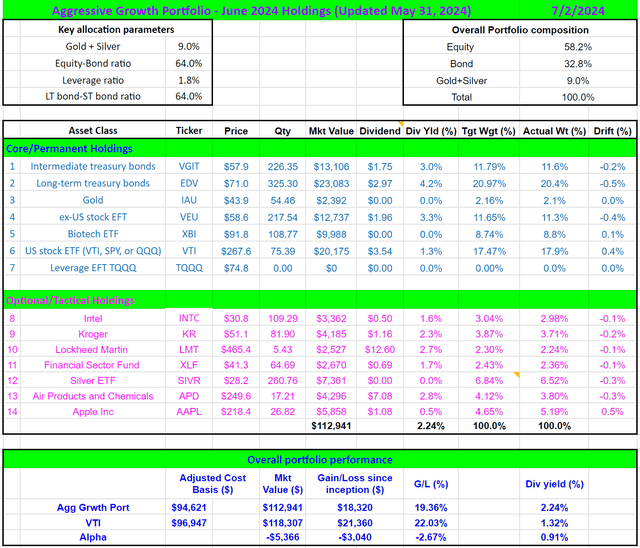
Read the full article here