


Understanding the economy is important to understanding the big picture.
Charlie Bilello
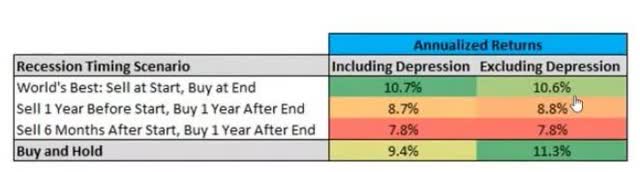
Market timing is not possible even if you can perfectly predict recessions.
Even if possible, it wouldn’t have improved investing returns outside of avoiding the Great Depression.
Understanding the context of the economy is vital so you can understand the “story” of Wall Street.
Narrative always follows price. Always.” – Josh Brown, CEO Ritholtz Wealth Management
When the market goes crazy in either direction, it’s natural to want to know why.
The truth is that no one knows the exact reason for the market’s short-term moves.
But understanding the “story”—what is most likely to happen in the short term—can keep you safe and sane, free from trying to market time your way to terrible returns.
20 Years Of Marketing Timing: 29% Real Returns Vs. S&P 200%
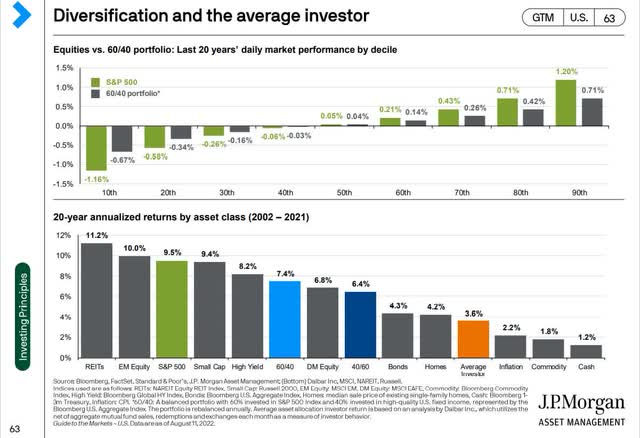
JPMorgan Asset Management
That’s the goal of these economic updates. As Bloomberg says, “Context makes all the difference.”
So, let’s explore some of the most important contexts for income investors to understand inflation, the Fed, and the economy.
Fact One: Inflation Is Coming Down Without Risking A Recession
FactSet Research Terminal
Core PCE is the Fed’s official inflation gauge. A 1.5% to 2.5% range with a 2% long-term average core PCE is the official inflation policy of the Fed.
Given Friday’s fresh inflation data, the sticky inflation early in 2024 looks “more and more like a bump in the road,” Omair Sharif, founder of Inflation Insights, wrote in a note following the release. “However you want to slice and dice it, we’ve made considerable progress on core inflation over the last year.” – NYT
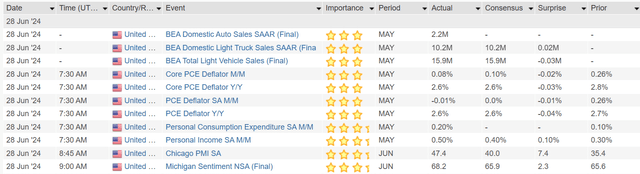
Last month, core PCE was 2.8% year-over-year, down to 2.6%.
Month-over-month, or MoM, core PCE was 0.08% or just 1% annualized.
Personal income rose 0.5% month-over-month, higher than expected and above last month’s 0.3% MoM.
- Last month, income grew 3.7% annualized
- Now growing 6.2% annualized
Consumer spending grew 0.1% month over month or 1.2% annualized last month and 0.2% month over month or 2.4% annualized this month.
Summary:
- Income growth: 6.2% annualized
- Core PCE: 1% annualized.
- Real income growth: 5.2% annualized
- Spending: 2.4% annualized
- Real savings growth rate: 2.8% annualized
This glorious report showed precisely what we want for a “soft-landing” Goldilocks scenario.
There’s no slowdown in growth or inflation, allowing the Fed to cut and thus preserve the economic cycle gradually.
Cleveland Fed Daily Inflation Nowcast
Cleveland Fed
The Cleveland Fed now expects July’s CPI report to be 3.1%, down from 3.3% this month.
MoM inflation growth of 0.07% is 0.85% annualized CPI. 5X less than income growth.
The Cleveland Fed expects next month’s core PCE to be 2.6% but annualized at 2.5%, based on the MoM rate of change.
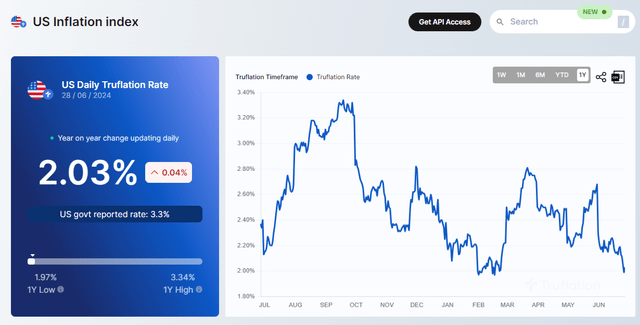
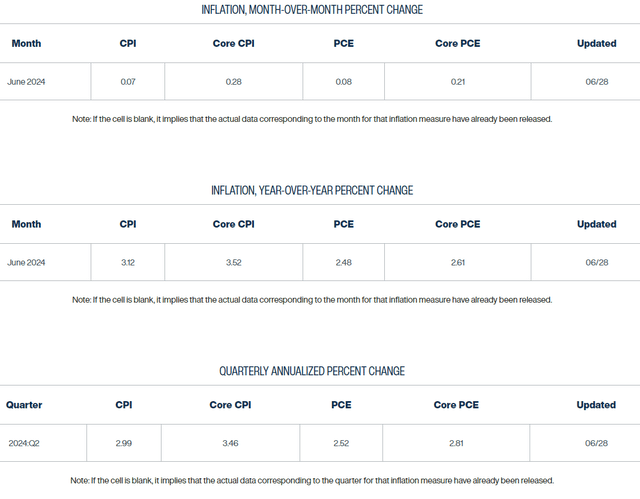
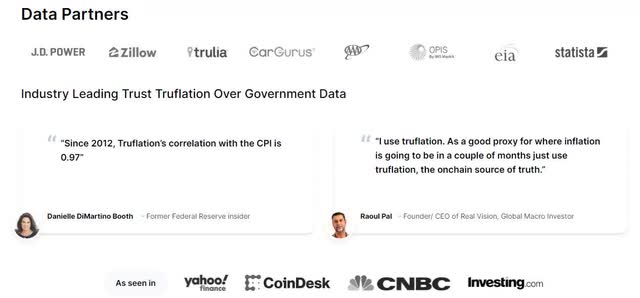
Truflation
Truflation uses 10 million data points from reliable data partners to estimate real-time inflation daily.
Truflation
Truflation
Truflation estimates that real-time inflation has come down to 2%, which coincides with 1.5% core PCE inflation.
If these numbers persist, Core PCE will likely settle at 1.5%.
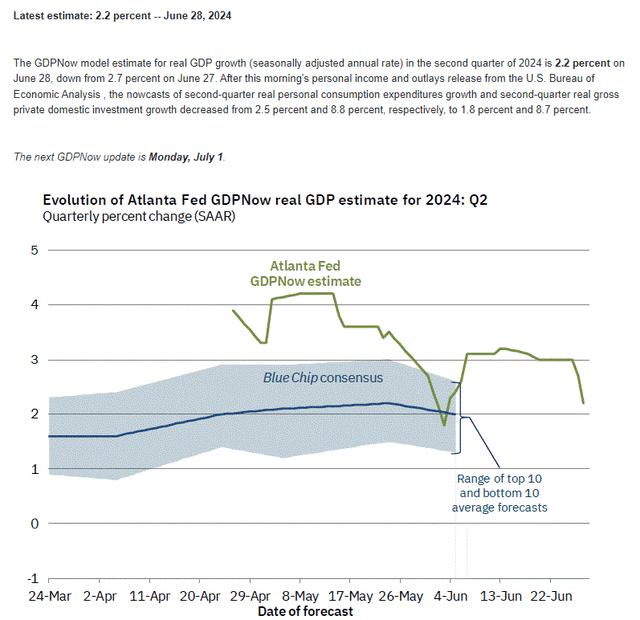
Atlanta Fed
The economic data is now posting around 2% GDP growth, historically typical for the US.
Continued 2% growth despite 5.25% interest rates would be a “no landing” scenario.
“Soft landing” means “0% to 1% growth that risks recession but avoids one.”
“No landing” means “growth keeps chugging along at the normal rate while inflation is tamed.”
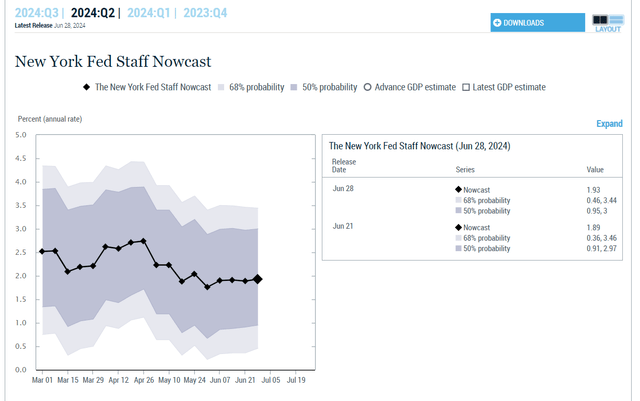
Nowcast
The New York Fed estimates growth this quarter is running at 1.9%, similar to the Blue-chip consensus and Atlanta Fed.
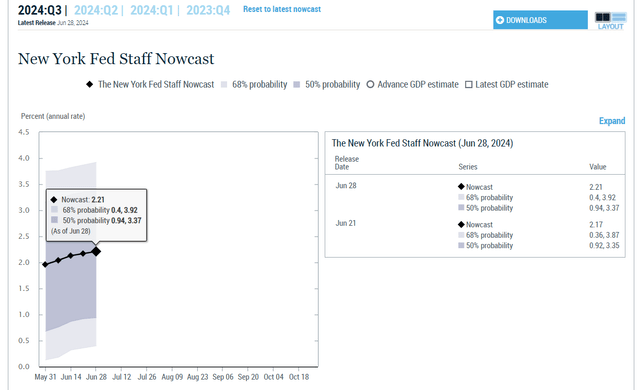
Nowcast
The NY Fed’s preliminary estimate for next quarter is for 2.2% growth, acceleration, and not close to a recession.
Fact Two: The Path For Interest Rates Is Likely Steadily Downwards
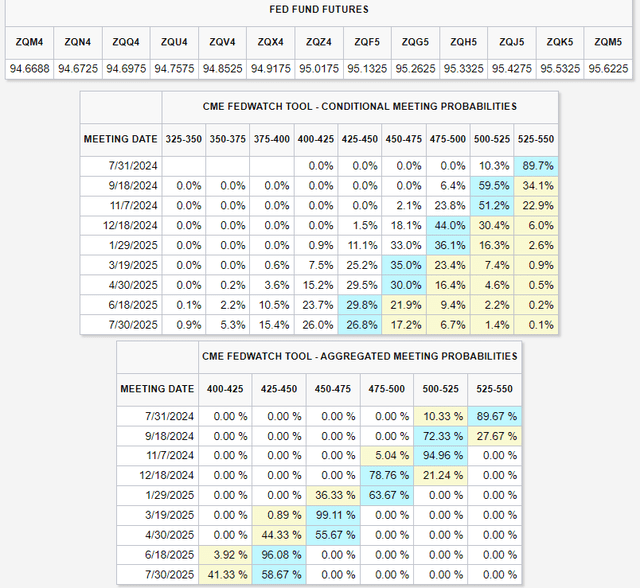
CME Group
The bond market is now pricing in a 96% probability that the Fed will cut four times within the next year and then hold.
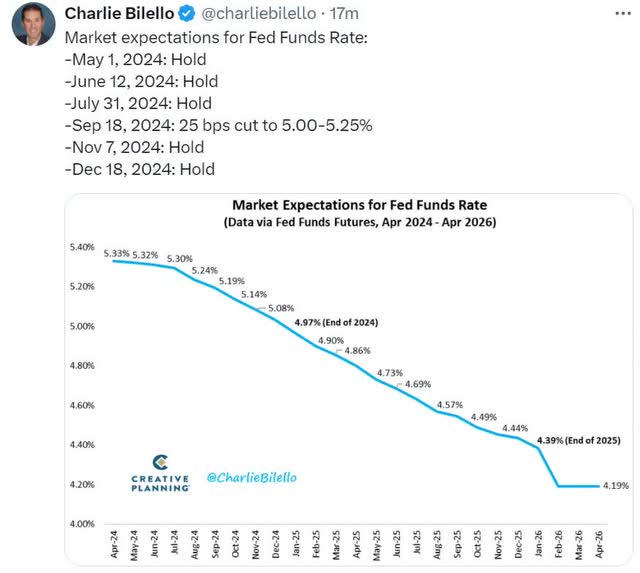
Charlie Bilello
The bond market thinks long term, and then the Fed cuts to 4%, and that’s the new normal.
That means about 4.2% high-yield savings and risk-free rates for savers.
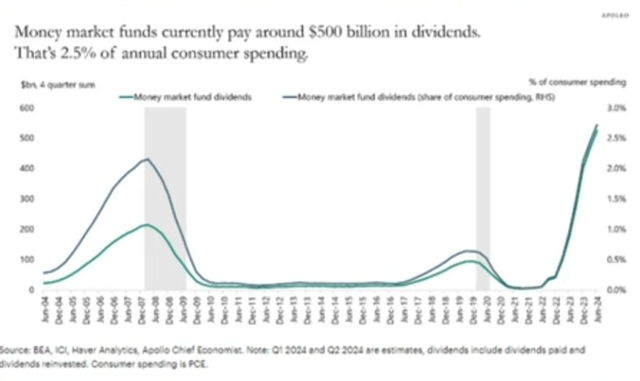
Ritholtz Wealth Management
The US government is running a stimulus program that sends $500 billion yearly, $1.5 billion per day, to T-bill savers and those with savings accounts.
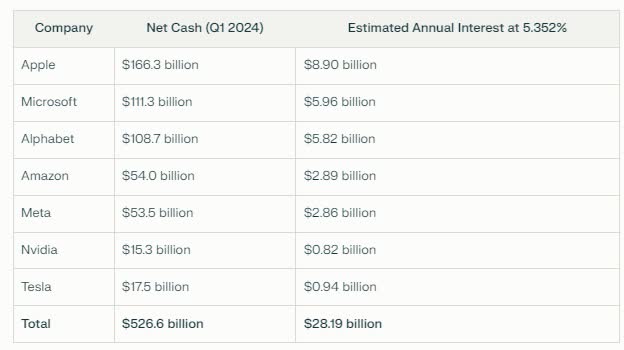
Perplexity
The US government is sending the Mag 7 over $2 billion monthly in income.
The bond market thinks this will come down a bit, around 1% to 1.25% over time, but the new golden age for savers will continue for the foreseeable future.
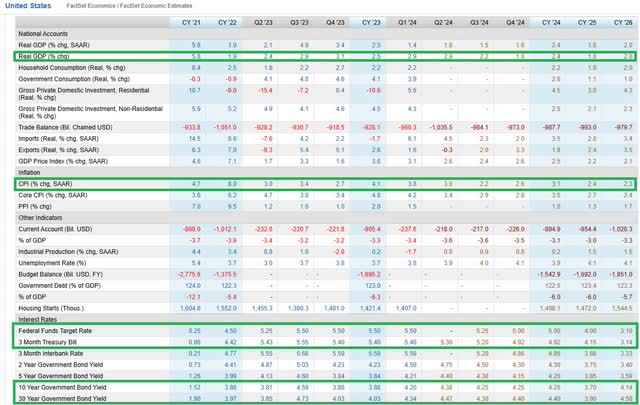
FactSet Research Terminal
Economists think the Fed will cut to 3%, which will be the new normal. From here, 10-year yields of 4% will modestly reduce corporate borrowing costs.
Charlie Bilello
30-year bond yields of 4.5% will be similar to today’s rates, solid returns for a powerful hedging asset in deflationary conditions.
Fact Three: Stocks Are Modestly Overvalued, But Not In A Bubble
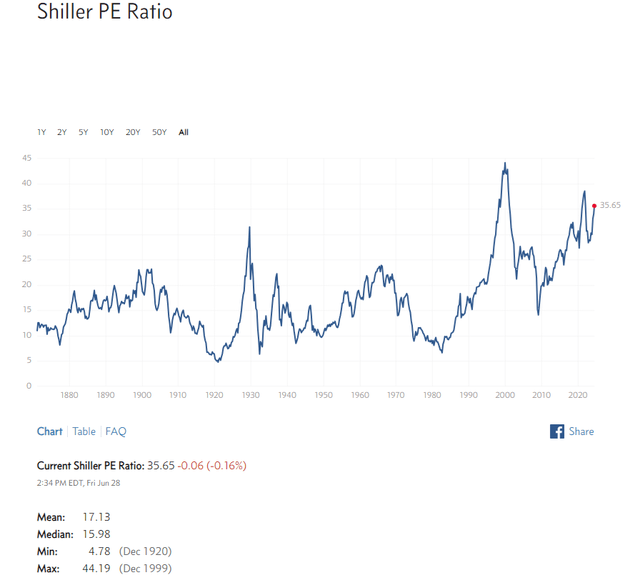
Multipl
Doomsday prophets love pointing to the CAPE ratio and claiming that the market will one day revert to a historical median of 16.
However, that’s not true.
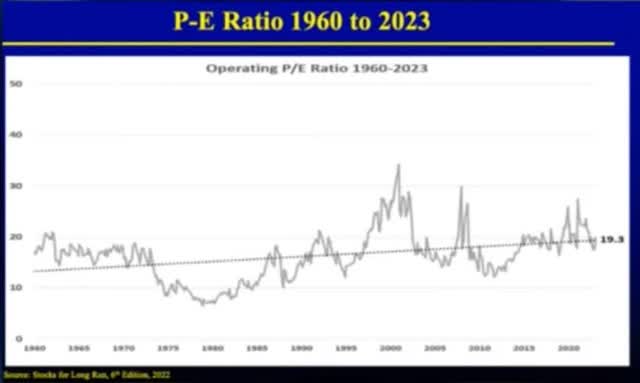
Ritholtz Wealth Management
Multiples have been rising for decades, and so have the CAPE ratios.
The 30-year CAPE is 28, and the world is a lot more similar to the last 30 years than the 1880s.
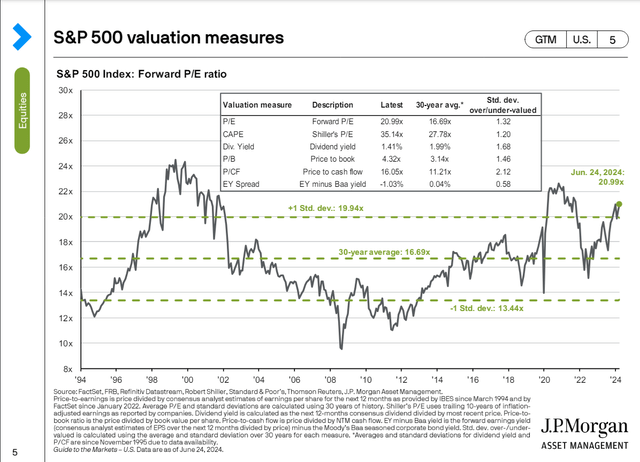
JPAM
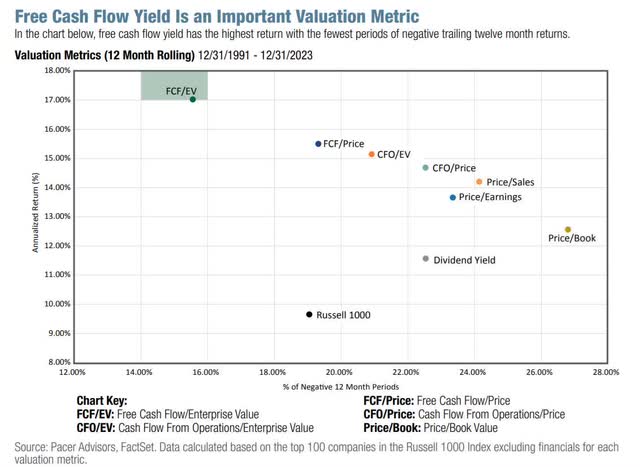
Pacer Funds
Enterprise value and cash flows are far better than the CAPE ratio.
S&P Valuation Profile
| Week | 26 | |
| % Of Year Done | 2024 Weighting | 2025 Weighting |
| 50.00% | 50.00% | 50.00% |
| Forward S&P EV/EBITDA (Cash-Adjusted Earnings) | 10-Year Average | Market Overvaluation |
| 14.54 | 13.64 | 6.40% |
| S&P Fair Value | Decline To Fair Value | Fair Value PE |
| 5,143.13 | 6.02% | 19.51 |
(Source: Dividend Kings S&P valuation Tool)
Stocks are not excessively overvalued if you factor in cash on balance sheets and growth rates.
| Potential Overvaluation (10-Year Average) | S&P 10-Year Average Cash-Adjusted PEG | S&P Current Cash-Adjusted PEG |
| -30.51% | 1.77 | 1.23 |
| Potential Overvaluation (25-Year Average) | S&P 20-Year Average |
S&P Current Cash-Adjusted PEG |
| -49.17% | 2.42 | 1.23 |
(Source: Dividend Kings S&P valuation Tool)
The S&P’s cash-adjusted PEG ratio is at historical lows, indicating that even if companies miss earnings expectations, they could likely avoid a bear market.
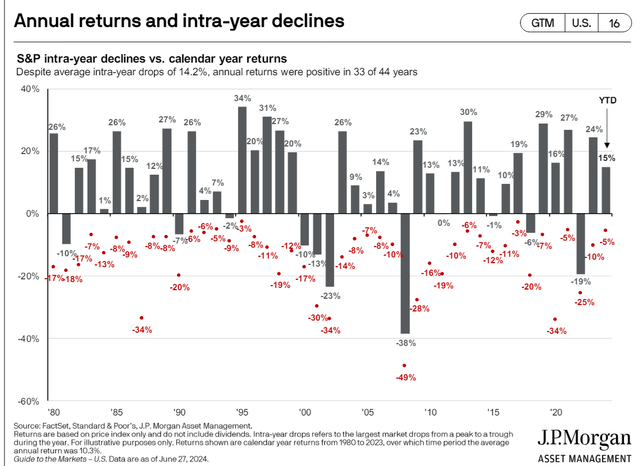
JPMorgan Asset Management
If stocks fall 14% in any given year, that’s normal.
A 10% to 15% correction doesn’t mean recession, economic catastrophe, or a stock mega crash.
FactSet S&P Bottom-Up Growth Consensus: 12.6% CAGR EPS Growth From 2023 to 2026
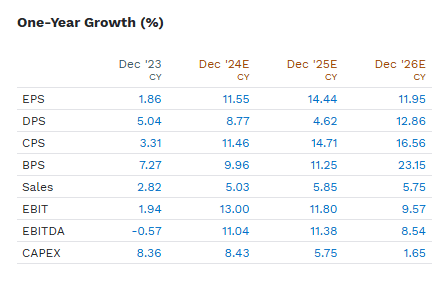
FactSet Research
Big Growth 22% Annual Free Cash Flow Consensus Growth Through 2030 (50% FCF)
If S&P earnings grow at 15% annually for 5.5 years, stocks will do well. Is that possible?
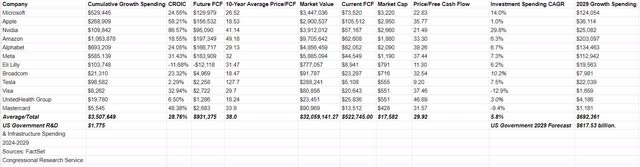
FactSet Research Terminal
This data is very bullish for the long-term prospects for US companies.
Unless the US government declares war on big tech and stifles their ability to innovate (as China has done), chances are good that US earnings growth will be permanently higher than historical levels.
It’s much easier for big tech giants to grow sales more than costs (preventing margin mean reversion) through broad moat network effects than for industrial giants in the past.
John Templeton and Howard Marks point out that 20% of the time, “this time really is different,” and stronger long-term US corporate earnings growth is likely one of those secular changes that doomsday prophets or even just bearish analysts like Grantham fail to take into account.
Bottom Line: The Macro Environment For Stocks Remains Favorable, Nothing Too Extreme Is Likely In The Next Few Months
Ignoring doomsday prophets like Robert Kiyosaki or John Hussman is a prudent decision.
And are you ignoring outlandish bulls like Cathie Wood? That’s also equally prudent.
The truth usually lies between the extremes in either direction. And the data right now shows neither a catastrophic recession nor a 6% to 9% GDP golden age.
I consider Tom Lee’s very pro-tech forecast for the S&P in the next few years the “best-case scenario.” However, One based on facts and reasoning is not the base case.
Don’t bet your future on stocks tripling in the next 5.5 years, but be open to the fact that the bottom-up consensus from FactSet and Morningstar is 50% free cash flow growth through 2026.
The largest growth stocks are expected to grow free cash flow at 22% annually through 2030 and earnings growth of 16% annually.
For dividend investors, owning companies like Meta (META), Alphabet (GOOG) (GOOGL), Microsoft (MSFT), and even NVIDIA (NVDA) could be a prudent approach to rapid income growth.
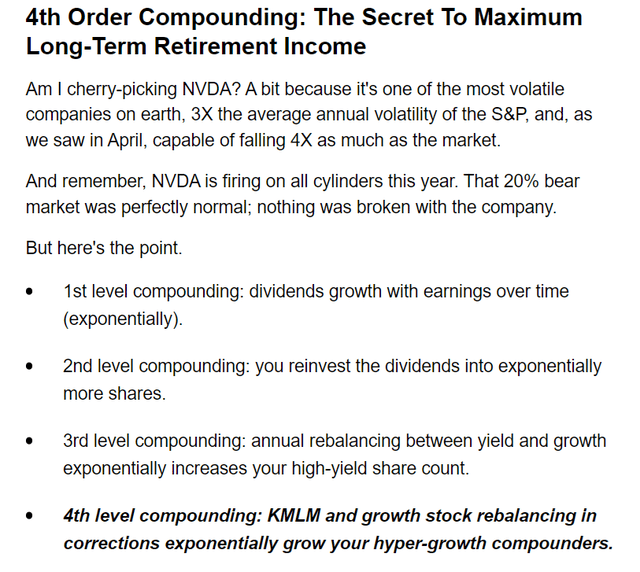
Quadruple compounding income investors like me, combining high-yield blue chips with hyper-growth Ultra SWANs and hedges, are another approach that can generate quadruped compound returns.
Dividend Sensei
If you’ve built a solid bunker and sleep well at night, and if you’ve created a retirement portfolio based on your specific needs, there’s nothing in the current economic data that should concern you.
Read the full article here