


Investment thesis
Based in Hilliard, Ohio, Advanced Drainage Systems, Inc. (NYSE:WMS) is a global manufacturer of innovative water management solutions. It predominantly operates in the stormwater and septic wastewater markets, but the company’s full suite of products is also pivotal across construction and agricultural applications globally. WMS is further distinguished by its extensive patent portfolio, which provides competitive advantages via capital-light business returns in the domain of water management technologies.
Figure 1. WMS share price evolution, last 5-years
Seeking Alpha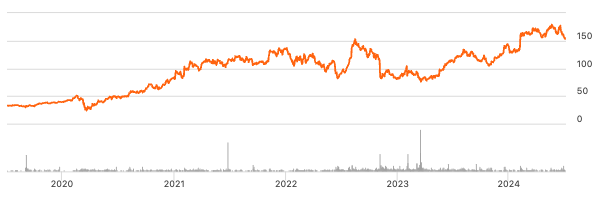
The stock is +20% in the last 6 months, but buying started to exhaust following WMS’ FY’24 results in May. Key takeouts were (i) the +14% dividend increase to $0.16/share, and (ii) the +22% returns on capital employed in the business. Given this, my observations are the market has fully captured this value at its current multiples – to trade higher than the current 22x EV/NOPAT and 4.6x EV/IC multiples is too far a stretch in my view.
The valuation baton must be passed to fundamentals and my opinion is management can drive value through 1) margin growth [post-tax margins are +8 percentage points to ~20% from FY’21-24], 2) management committing further resources to growth, competitiveness + efficiencies [i.e. further margin growth], and 3) usage of surplus cash flows [the average FCF is ~$435 million every rolling 12 months].
However, due to the sensitivity to operating margin vs. additional value drivers, I am hold on WMS, seeking a more attractive starting valuation. Net-net, rate hold.
Why WMS is a great business
Credit must be served where credit is due. WMS is a great business for several reasons, starting with its qualified growth record. Growth is meaningless unless indexed against the capital used to engender it.
- In that vein, the value of earnings per $1 of capital invested into WMS’ operations has compounded exceptionally:
- Operating earnings of ~$39mm in FY’14 grew to $723mm in FY’24, thus WMS’ management compounded earnings at CAGR +33% per year for 10 years producing $684mm in incremental earnings growth (pre-tax),
- This is against a $1.86Bn increase in capital required to maintain these earnings – only 15.8% CAGR,
- Thus we see +$684mm earnings growth on +$1.86Bn incremental investment, tallying ~36% marginal return on investment.
- Although, it is more nuanced than this – from FY’15-’20, the incremental return on WMS’ new assets was ~21%. But from FY-20-’24, it shed ~$584mm of capital from its base [inc. through dividends], yet operating earnings increased by $554mm, totalling ~5.4x return on its existing assets. This was all margin-related, as capital efficiency remained roughly the same.
Finding investment managers that can compound capital at +35% over an extended period is challenging. Let alone through various market cycles etc.
Figure 2.
Company filings, author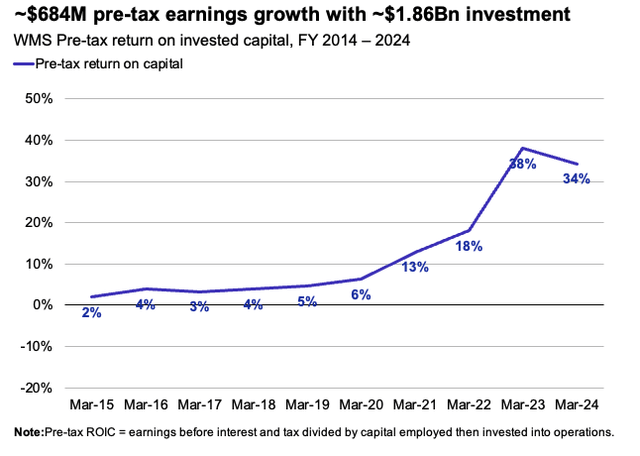
- Returns are driven by 1) increasing post-tax margins [management added 750-800bps to NOPAT margin since FY’21], and 2) reasonably efficient turnover on its investments. Critically, the economic leverage on WMS’ investments is high – management methodically produced double-digit returns on its new investments from FY’21-’23 (Figure 3). This follows extensive reinvestments into operating efficiency for automation, manufacturing + recycling capacity and increased productivity. They were also >12%, indicating substantial economic value add – but the trend waned in FY’24, corroborating the exhausted trend. Subsequent freely available cash more than doubled, and management looks to comfortably produce ~$450mm in FCF at this pace of business every 12 months. The questions now are 1) what opportunities do management have in front of itself now, 2) where can the funds be redeployed [outside of dividends + buybacks], and 3) how long will this advantage period last?
Figure 3.
Company filings, author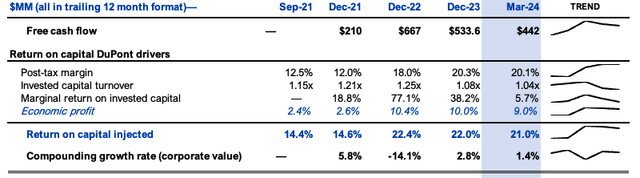
- The magnitude of economic value has totalled ~$830mm since FY’21 in my view – judged by the cumulative economic profits (“EPs”) management produced since 2021 [EP is the surplus return above a 12% hurdle rate. This figure represents the LT market averages, and thus the opportunity cost of holding the indices. It is also a reasonably high watermark to pass]. Investors have paid a 3.5x multiple on this, adding ~$2.9Bn in enterprise value since the end of 2021. This multiple is in keeping with its historical EV/IC ranges of 3-4.5x. Based on my FY’24-’27E estimates, it could produce a cumulative c.$1Bn in EP over the next 3-years. Assuming the 3x multiple, this is +$3Bn incremental market value, getting us to ~$15.9Bn implied EV by 2027.
Figure 4.
Company filings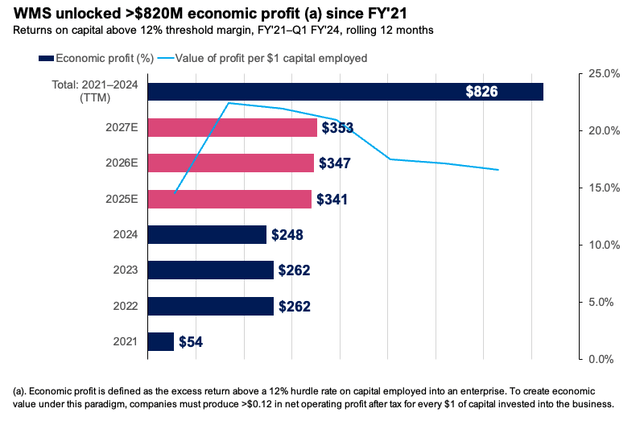
- Management projects ~$250-$300mm capital spend in FY’25 which is >2x the historical range of FY’21-’24. This equals ~30% of est. EBITDA of $980mm at the upper end of the range, on sales of ~$3Bn. Crucially, this implies ~32% adj. EBITDA margin, equal to this year’s result. My assumptions are in line with these estimates [see: Appendix 1]. My estimate is the expected life of WMS printing >12% ROICs is ~9-10 years, with a fade rate of ~10% to the corporate average return of 6-7% (Figure 4). Notably, this is down from FY’22, and fits with the sideways movement in stock price. The embedded risk to the thesis is a multiple contraction of ~0.5x in my worst-case scenario. Why? Because the expectations on its forward growth is higher than in FY’22, for instance. This means the margin for error is higher – a 26% EBIT margin is required to trade higher from here, in my view. Management can do this, in my view, but should it fail [due to any litany of factors] – WMS’ valuation is highly sensitive to this.
Figure 5.
Author estimates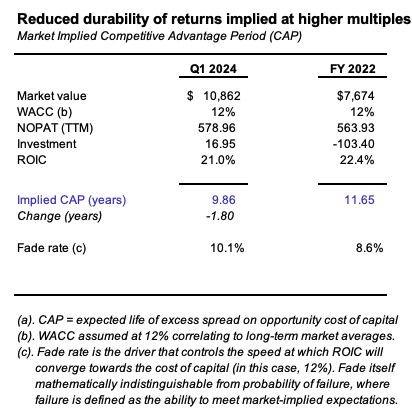
Figure 6.
Author estimates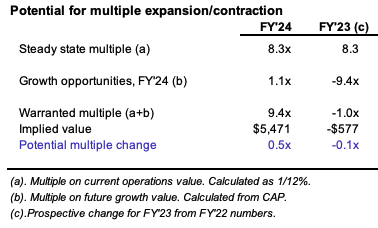
Valuation highly sensitive to pre-tax margins
Investors have captured several things well in WMS’ current market value – 1) recent margin growth, 2) management’s capital allocation + the results of, 3) the higher dividend [indicative of earnings quality] and 4) the future value of its growth opportunities.
Where WMS trades from here is most sensitive to operating margin vs. capital efficiency. Assuming 1) 2.2% compounding sales growth to FY’26, 2) 26% pre-tax margins with 23% tax rate, and 3) a capital reinvestment rate of ~$1.50 per $1 of revenues [due to management’s planned investment ramp], I get to an implied value of $181-$188/share by FY’26E, with the stock trading at a reduced multiple of 20.3x EV/NOPAT and 4.4x EV/IC. This is just ~6% CAGR and not enough flesh to put on the skeleton.
Valuation insights
- Valuations are supported to ~$180-$188/share by FY’26E at ~20x my FY’24 estimates of NOPAT. Notably, the critical factor is the margin growth moving forward. The critical factors are that my estimates bake in:
- ~26% pre-tax margins, +300bps on the FY’21-’24 average,
- ~1.0x turnover on capital invested into WMS’ business operations.
- As such, the key risk is that margins don’t hold this level [they are 26% in the TTM, consensus expects similar in FY’24 too]. If WMS prints operating margins of, say, 22% to FY’26 instead, the stock looks overvalued to me. Thus, it all hinges on the marginal analysis moving forward.
- Regarding WMS holding >25% margins pre-tax, this is supported by 1) strengthening fundamentals in the infrastructure, building and agricultural sectors, and 2) management’s strengthening the company’s ROICs [I see a competitive advantage period (“CAP”) of ~9-10 years, below FY’22, but still high], with 3) a fade rate of ~10% to the long-term corporate average 6-7% return on capital, and 4) management’s clear efforts in investing for efficiency. Here is the CEO’s language from the FY’24 call:
In fiscal 2025, we will achieve our guidance through volume growth and fixed cost absorption as well as operational efficiency as we reap the benefit from capital investments we have made in manufacturing and transportation over the last several years…
…As you will recall from previous quarters, we have talked about investing in our business to strengthen our competitive position when the market recovers and that is exactly what we are doing today
- Investors have re-rated the stock sharply off FY’22 lows as fundamentals improved substantially. We now pay ~22x NOPAT and 4.6x invested capital to buy WMS today. Management invested ~$763mm incrementally from FY’21, and investors increased the EV by $4.15Bn. Thus, each $1 investment created $5.45 in new market value. My observation is the market values the profits produced by every new $1 of capital WMS invests at ~4.5-5.5x. The risk, in my view, is a contraction back to ~20x NOPAT or less, meaning fundamentals need to pick up the slack.
Figure 7.
Author, Seeking Alpha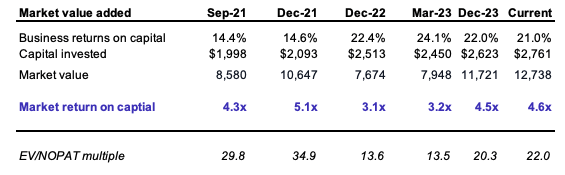
- If investors maintain the current 22x multiple, I get to $15.3Bn in EV, or $198/share – but WMS has to produce the level of EP described earlier in my view. It depends on whether investors continue paying the high premium or not – backing the multiples off, fundamentals aren’t there to do the heavy lifting. More so if the margin compresses – if it does 23% pre-tax margin instead, even at the 22x, the valuation is ~$175 by FY’26E, and the stock looks overvalued by ~$25/share today.
Figure 8.
Author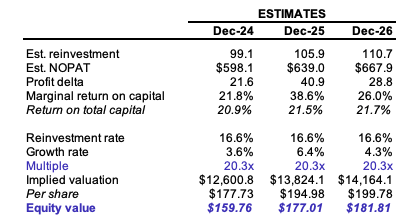
Figure 9.
Author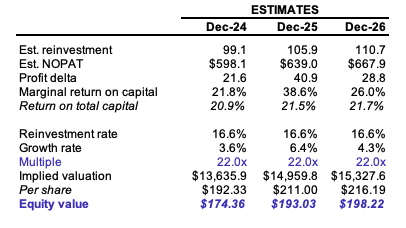
- Critically, I am running very conservative assumptions to see if WMS can still surpass more pessimistic markets. On the business side, it can [+20% returns on its operating capital, high and stable FCF, increased reinvestment at these high rates]. To show how sensitive the valuation is to its pre-tax margins, ran the scenario of ~23% operating margins, but increased the implied reinvestment rate to ~30% of NOPAT [roughly in line with management’s plans]. Here we get to ~$198/share by FY’26, but we still need the 22x multiple.
Risks
Downside risks to the thesis include 1) WMS not hitting a pre-tax margin range >25%, 2) substantial increase in OpEx for the same reason, and 3) sharp contraction in multiples towards 22x NOPAT.
Upside risks include the fact it could hit the 26% margin, which justifies a higher valuation, the fact management are reinvesting higher sums in the business, which can produce outsized results, and the potential for rates to lower earlier than expected, creating a tailwind for equity valuations.
In short
Given the valuation calculus’ sensitivity is most skewed to the upside from a single variable [operating margins] versus a combination of drivers [sales growth, margins, capital turnover, reinvestment, and so forth] my confidence in gauging the valuation is diminished. Whilst I am bullish on the stock, my conviction is lowered by the fact 1) investors have captured much of the company’s growth opportunities in the current valuation, and 2) the expectations are exquisitely high on it hitting desired efficiencies. Small changes in the estimates of margin have an outsized impact on my estimates of value just 3 years out – one can only imagine the asymmetries in longer forecast periods for DCF purposes. As such, my views are that (i) WMS is a great business, but (ii) the potential for outsized investment returns is small at current valuations.
Read the full article here