


Thesis
The Defiance R2000 Enhanced Options Income ETF (NYSEARCA:IWMY) is an equities exchange-traded fund. The ETF has a ticker which represents a play on words based on the iShares Russell 2000 ETF (IWM). We are assuming the Y in ‘IWMY’ comes from ‘Yield’, thus ‘IWMY’ is the Russell 2000 with yield.
Options-based ETFs have seen explosive growth in the past two years, and IWMY is no different. The fund IPO-ed last year only (October 2023) and represents yet another offering that aims to extract high distributions from the equity markets.
In this article, we are going to have a close look at IWM, its build and analytics, and derive an opinion regarding the usefulness of the vehicle in different market scenarios.
Always understand what you are buying
The 101 of investing is understanding what you are buying as an investor. If you do not understand it and you do buy it, then it is called gambling. IWMY employs a fairly simple options strategy that involves writing cash-covered puts:
A cash-secured put-also known as a cash-covered put-involves having enough money in your account to cover the cost of potentially buying an underlying stock that you sell a put on.
The fund then parks most of its cash in short-term government securities:
Holdings (Fund Website)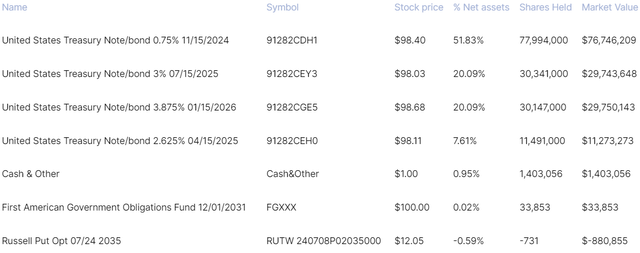
In the above fund snapshot coming from their website, we can notice that Russell in July put in an amount of 731 contracts, and the rest of the holdings represented short-dated treasuries generally, with the maximum maturity out to January 2026. There is also a pure cash bucket which is used for unit creation/redemption.
The fund therefore makes money only from two sources:
- Premiums received on writing puts.
- Interest income from the Treasury Notes held.
Writing puts is a business with a capped upside, while the downside is very similar to owning the exposure outright. Option Alpha does a good job of putting the respective pay-off in a graph:
Payout Profile (Option Alpha)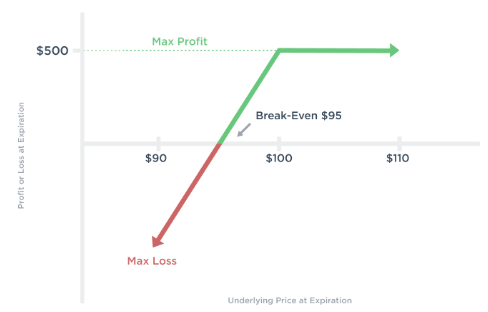
The maximum profit for writing puts is the option premium received, while the downside is equivalent to the underlying exposure minus the premium received.
The fund does well only when the market is range-bound
There are only three market scenarios present for a fund – a market rally, a sell-off, or a range-bound market. Let us analyze each one for the contemplated name.
Scenario 1. The market rallies:
- the written puts expire without getting triggered.
- the ETF pockets the premium.
- the upside generated is capped by the premium received.
- the fund will lag an outright IWM position since the upside is capped by the option premium.
Scenario 2. The market sells-off:
- the put gets triggered.
- on the settlement date, the ETF pays the difference between strike price and spot price or goes long a portion of the index.
- the downside equates to the IWM downside minus the premium received.
- the fund virtually mirrors IWM on the downside.
Scenario 3. Range-bound markets:
- IWM bounces around in a tight range.
- the ETF pockets the premium.
- an outright IWM position does not generate a high return, thus IWMY can match that performance or even outperform.
- the fund makes money from both the underlying Treasury Notes and the premiums on the equity index.
2024 is the perfect example of a range-bound market for IWM:
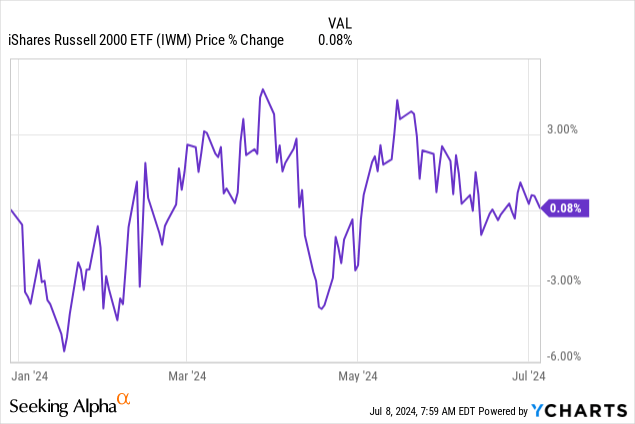
From a pure price perspective, IWM has bounced in a -5% to +5% range this year. This range-bound performance has translated into IWMY realizing its written option premiums, and thus outperforming IWM so far:
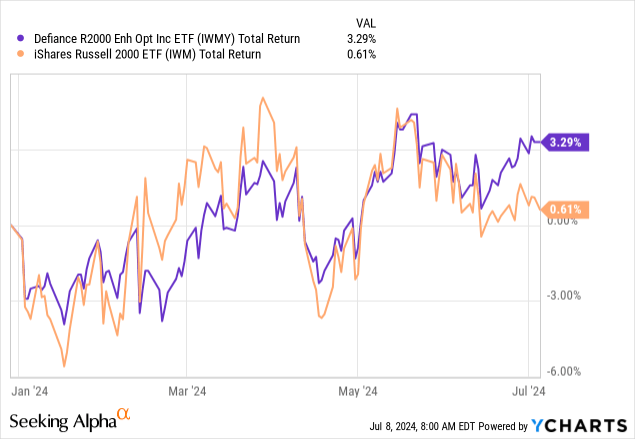
We can see from the above table how IWMY is up 3.29% on a total return basis in 2024, while IWM is virtually flat on the year. The outperformance however is very small on a net basis, sitting at roughly 300 bps.
The distribution rate is not real
If you visit the IWMY website as an investor, you will see very high distribution rates presented. Do not believe them since they are not real. We will go into that in a minute. Just as a rule of thumb though, always look at the macro picture – extracting high distribution rates from equities only works for high growth stocks that move up a lot. IWM is not known for its high growth, thus from the onset one should know something is off.
While the fund presents a distribution rate in excess of 50%, it is not real:
Section 19 Notice (Fund Website)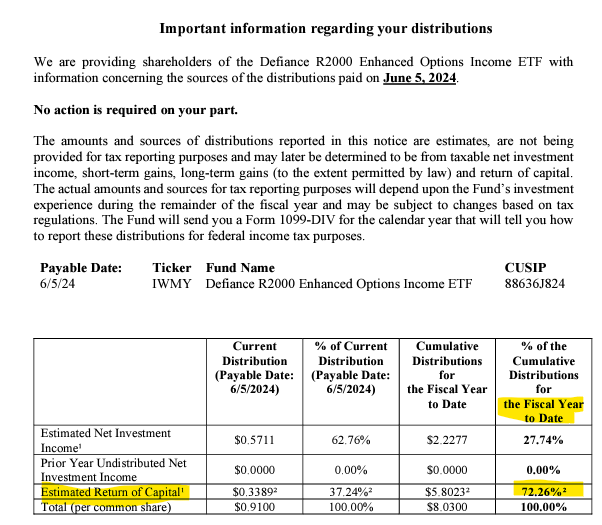
You will be surprised to find out from the fund’s Section 19 notice that it is a heavy user of return of capital (or basically giving you back your own capital). Structurally speaking, only CEFs are heavy users of ROC, but any fund who does use it needs to report it:
Federal securities law requires a fund to provide shareholders with a 19a‐1 Notice if a distribution is made from a source other than net investment income.
Depending on what IWM does during a year, IWMY’s actual distribution is much much lower, basically close to 7% or 8%.
The heavy ROC utilization has caused IWMY’s price to move down every month since the fund is using its own NAV for its very large ‘interest’ distribution:
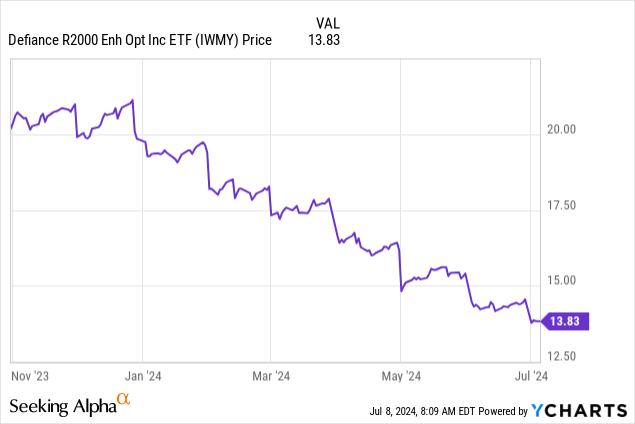
Expect this trend to continue if the fund uses such high amounts of ROC. We are not fans of ROC, especially in the equity space. In reality, IWMY has posted a total return of only 3.29% this year despite its large distribution rate on its website. Growth stocks can deliver outsized returns outright or via options. Small caps do not historically deliver that.
Are there any advantages in holding IWMY?
IWMY only performs in a scenario like the one seen in 2024 when IWM outright is range-bound. However, even this year the outperformance is only 300 bps while giving up most of the upside in a bull scenario like we saw at the end of 2023:
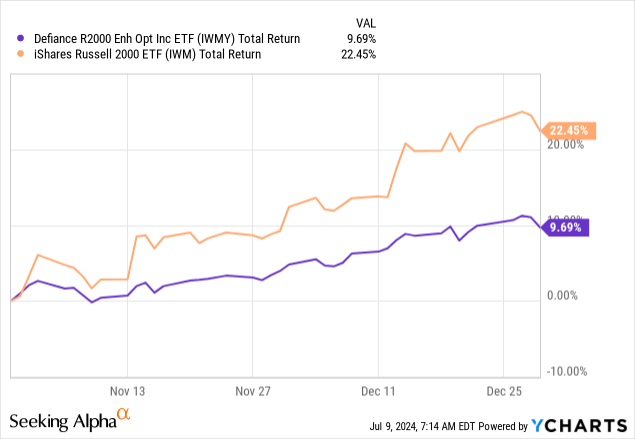
IWM was up 22% from mid-October 2023 to December 2023, while IWMY was up only 9%.
We are also loath that IWMY uses such a high distribution rate which is not real (i.e., based on IWM historic growth levels). This will cause pricing to move down continuously on the ticker and give the false impression that the high distribution rate is based on moves in the underlying equities. If the fund did not use any ROC it would make more sense in our mind, since it would be a true reflection of performance and it would avoid any tax implications for holding the name.
Conclusion
IWMY is an equities ETF. The fund writes puts on IWM and pockets the premiums when the Russell 2000 is range-bound or moving up. The rest of the ETF’s cash is invested in treasury notes, thus earning a robust yield in a high risk-free rate environment. IWMY only outperforms in a range-bound market for IWM, just like in 2024. In a bull market, IWMY does not capture any upside outside the premiums received. Even now though, it is up only 3.29% for the year on a total return basis despite its enormous stated distribution rate. The fund is a heavy user of return of capital and its distribution rate in excess of 50% is not real. We do not like the high ROC utilization in an ETF structure, nor the high distribution rate for a market like small caps which does not historically exhibit enormous growth. We do not like the IWMY structure with a high unsupported distribution and feel a retail investor is better served by an outright IWM position.
Read the full article here