


Murphy USA (NYSE:MUSA) has been one of the best performing stocks of the last decade, with the stock appreciating 13x since it was spun-off from its previous parent company, Murphy Oil (MUR). As of the end of 2023, the share price has compounded at a 20%+ CAGR while shares outstanding was reduced 55%.
History
MUSA operates convenience stores where it sells petroleum products and other convenience merchandise through its network of 1,733 retail stores across 27 states. MUSA, incorporated in 2013 as a spin-off from Murphy Oil Corporation, was established to exist near Walmart stores. MUSA would acquire property from Walmart to build its stores, which was (and continues to be) mutually beneficial as MUSA provided affordable gas to Walmart customers while Walmart provided consistent traffic to MUSA. This partnership was terminated in 2016 when Walmart decided to take fuel in-house and build out its own fueling locations as it continued to build its footprint.
MUSA continues to collaborate with Walmart on fuel discount programs, including Walmart+. In 2021, MUSA acquired the QuickChek convenience store brand for $645 million which brought 157 stores, primarily in the northeast, into MUSA. MUSA originally used kiosks in its locations which were small but cheap to run. These are being rebuilt into 1,400 square foot locations to offer a larger assortment of merchandise.
Today, MUSA is a high volume fuel retailer that also sells a a large volume of tobacco products. Both of these products drive repeat customers, which provide consistent foot traffic for MUSA. MUSA is also focused on both reduced-risk products and non-tobacco convenience products, with non-tobacco margin dollars having strong performance in Q1 2024.
Business Model
Here is the flywheel that MUSA details in its 2023 investor presentation:
Murphy USA 2024 Investor Deck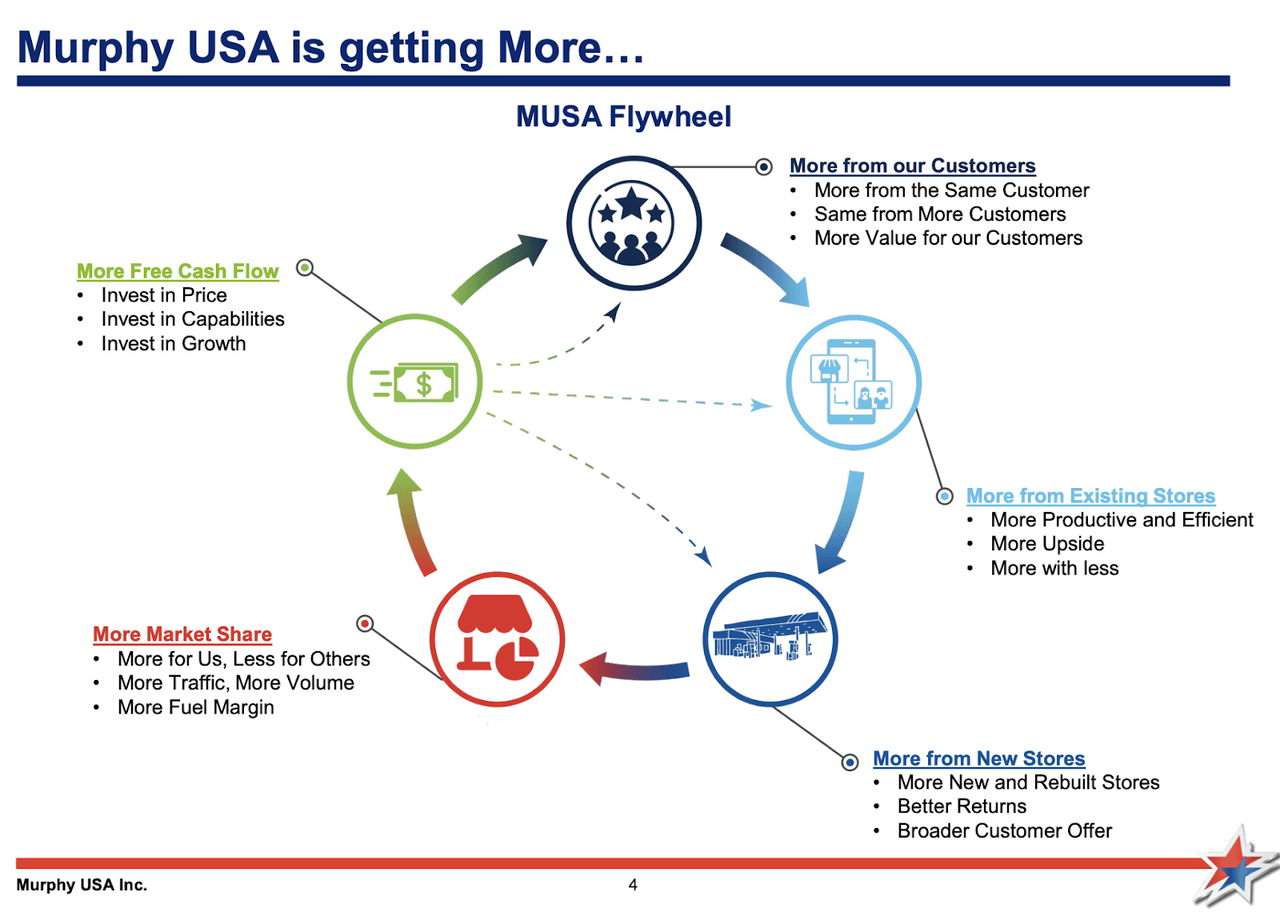
MUSA drives value to its customers by offering competitively priced gasoline. MUSA caters to the consumer that is living paycheck to paycheck, which is why affordable gas is a large driver of traffic to its stores. These customers value affordability and MUSA is able to gather important information on these customers through its Murphy’s Drive Reward (MDR) program, which offers discounts on gas and targeted promotions. Once MUSA gets customers into the MDR program, they visit the store 5 times per month and spend on average $177 per month. The retention rate is 85% after one year and the 2023 vintage of rewards members come as often as the original 2019 vintage.
MUSA stores tend to be smaller than competitors, with MUSA offering 1,400 and 2,800 square foot stores, which MUSA believes result in lower CapEx and utility costs. Stores require one to two associates and three-fourths of stores are on company-owned property resulting in no rent payments.
MUSA continues to invest to keep its fuel cost more competitive than surrounding stores, which in turn drives the traffic which allows it to gain market share over its competitors. With the cash flow MUSA generates, it prioritizes growth, share repurchases and dividends.
MUSA’s revenue mix is primarily dominated by petroleum product sales (typically in the high ~80% of revenues) and merchandise sales (the majority of the balance with a large portion from tobacco products). Here’s a look at 2023 numbers from the 10-K:
|
Revenue (MM) |
|
|
Petroleum |
$17,104.4 |
|
Merchandise |
$4,089.3 |
|
Other |
$335.2 |
|
Expenses ($MM) |
|
|
Petroleum COGS |
$15,929.7 |
|
Merchandise COGS |
$3,285.9 |
|
Store OpEx |
$1,014.6 |
|
D&A |
$211.9 |
|
SG&A |
$240.5 |
This puts 2023 operating income (or EBIT) at $842 million and EBITDA at $1.0 billion. With a market cap of $9.85 billion and $1.79 billion of debt (~$125 million of capitalized leases included), the total enterprise value of the company is approximately $11.6 billion, or ~13.7x 2023 EBIT and ~11.6x 2023 EBITDA (I used 2023 numbers to keep things easy). MUSA’s Q1 earnings came in light due to weak fuel margins so it would skew valuations. When valuing companies, I’m always going to try and reference normalized earnings.
From a 2023 cash flow perspective, MUSA generated $784 million of cash from operating activities and had $335 of CapEx for free cash flow of $449 million, or a 4.5% free cash flow yield, which is expensive on a trailing twelve month rate compared to treasuries.
I wanted to finish this section by noting the key metrics where management is compensated. Charlie Munger was famous for saying “Show me the incentives, and I’ll show you the outcome.”
- Adjusted EBITDA — Adjusted EBITDA is computed by adding net income (loss) plus net interest expense, plus income tax expense, depreciation and amortization, and Adjusted EBITDA adds back (i) other non-cash items (e.g., impairment of properties and accretion of asset retirement obligations) and (ii) other items that management does not consider to be meaningful in assessing our operating performance (e.g., (income/loss) from discontinued operations, net settlement proceeds, (gain) loss on sale of assets, transaction and integration costs related to acquisitions and other non-operating (income) expense).
- Fuel Volume — Thousands of gallons average per store month (APSM) for all stores in full month of operation
- Fuel Margin Contribution — Fuel Contribution means the overall profit (margin) made on fuel volume sold after applicable expenses are paid and is calculated (i)(A) petroleum product sales plus (B) RINs and other, less (ii) petroleum product cost of goods sold
- Merchandise Margin Contribution — Merchandise Contribution means the overall profit (margin) made on merchandise sales after applicable cost of goods sold
- profitability as measured by Coverage Ratio — Coverage Ratio is computed by dividing Merchandise Contribution by OpEx plus allocated G&A and other expenses
In simple terms, this tells me management is incentivized to grow fuel volumes, grow total fuel contribution (notice how its not %, it’s the total amount of money), grow merchandise contribution (again, total $$) and coverage of profitability. All of this aligns with what I noted above, a high volume fuel retailer selling higher margin merchandise.
Capital Allocation
Since the spin-off, MUSA has generated over $6 billion of cash flow, of which 40% went to capital expenditures, 48% went to share repurchases, 1% went to dividends and 11% went to M&A.
-
Growth — There is a three pronged approach to growth at MUSA. Free cash flow is used to invest back into offering the lowest priced fuel, supporting the transition to reduced-risk products. Operationally, MUSA is focused on managing store labor and having a low cost-operating margin. The last area of growth is new stores, which MUSA both builds, rebuilds, and acquires.
-
Capital Return – As noted above, MUSA has a robust history of share buybacks as it has more than halved the share count since the spin-off. In the Q1 call, MUSA noted its goal of repurchasing approximately 1 million shares annually. In addition, MUSA has ramped up its dividend program over the last few years. It initiated its dividend program in late 2020 and began quarterly raises in mid-2022. The Q2 2024 dividend of $0.44 was a 4.7% bump over the Q1 2024 dividend and a 15.7% bump over the Q2 2023 dividend. While the quarterly raises are great, I’ll continue to anticipate yearly dividend increases as the company continues to mature.
2024 Estimates
For 2024, MUSA guided to roughly $1.0B – $1.2B of EBITDA (during the Q&A session on the Q1 earnings call, management noted it may come in at the lower end of that range). $1.0 billion of EBITDA reaffirms the ~11.6x EV to EBITDA multiple from above, while $1.1B of EBITDA would bring the multiple down to approximately 10.5x.
In 2024, MUSA anticipates 30-35 new stores with 35-40 rebuilds and $400MM to $450MM of capital expenditures. This results in roughly ~$500MM of potential 2024 free cash flow, increasing the current free cash flow yield closer to 5%. While that remains relatively expensive, it is cheaper than peers such as Casey’s General Stores which sports a 26x P/E (compared to MUSA’s 19x). This makes sense, CASY is more similar to a QSR name as it sells a large volume of pizza every year. MUSA’s valuation is more in line with its closer peer, Alimentation Couche-Tard, (which also trades at 19x earnings) but that is a recent phenomenon as MUSA has outperformed ATD over the past year by 30 percentage points.
2028 Estimates
MUSA’s 2024 investor deck provided a relatively simple 5-year plan for MUSA:
- Grow stores to ~1,950
- Reduces shares outstanding by 1MM annually
- Grow EBITDA to ~$1.3 billion
Simply applying a similar market cap to EBITDA multiple as we see today (~9.8x) we would get a market cap of around $12.7B. After accounting for the share reduction to 15.7MM shares, we would arrive at a per share value of $811, or an 11%+ CAGR (excluding dividends and dividends likely add another 0.5% annually).
In addition, MUSA has noted it’s afraid to raise debt to retire shares if the market provides it the opportunity.
Conclusion
While an entry point earlier this year would have been ideal given the large run-up, quality stocks don’t stay undervalued long. The thesis here is quite simple, a slow grower at a reasonable valuation buying back a ton of stock over the next five years. These are some of the exact situations I like in companies: well run enterprises in what people view as dying industries (tobacco + fuel) that generate enough cash to grow and return the excess to shareholders. AZO and ORLY are similar examples of companies with fantastic returns as they bought back a boat load of stock while their valuation remained reasonable.
While MUSA appears expensive compared to historical valuations, a lot of that was likely worries around terminal value due to EVs and a decline in tobacco. Given the likely overstatement of EVs (the QuickChek brand has some EV chargers so MUSA understands the space) and MUSA’s embracing of reduced risk products, the company should continue to be a strong performer in years to come. It’s a stock I own in my dividend growth portfolio that I will build out slowly and will rapidly accumulate upon a dip.
Read the full article here