


Summary
- Market sentiment flipped from a sharp, risk-off drawdown to a historical V-shaped recovery in the second quarter, driven by fading tariff fears and an enthusiastic embrace of pro-growth policies. The Russell 1000 Growth Index (the “Index”) rebounded +33% following a rapid -23% correction—a rally concentrated in a small subset of stocks.
- Performance leadership during Q2 was dominated by AI-focused sectors (especially semiconductors) and high-beta cyclicals, resulting in a dramatic reversal from Q1. Higher-risk managers outperformed after lagging in the prior quarter, illustrating unusually rapid shifts in market dynamics reminiscent of periods like the late 1990s Tech Bubble and early 2020 Covid-19 recovery.
- In the second quarter of 2025, the Polen Focus Growth Portfolio (the “Portfolio”) returned 9.36%, compared to 17.84% for the Russell 1000 Growth Index and 10.94% for the S&P 500.
- Top relative contributors to performance included Apple (AAPL) (sold early in the period), Oracle (ORCL), and Netflix (NFLX). The top absolute contributors were Oracle, Microsoft, and Amazon (AMZN).
- The largest relative detractors in the quarter were NVIDIA (not owned), Thermo Fisher Scientific (TMO), and Broadcom (AVGO) (not owned). The largest absolute detractors were UnitedHealth Group (UNH), Thermo Fisher Scientific, and Apple.
- We initiated a new position in IDEXX Laboratories and eliminated our positions in Apple and UnitedHealth Group. We added to existing positions in Starbucks (SBUX), ServiceNow (NOW), CoStar Group (CSGP), and Adobe (ADBE), and trimmed our position in Amazon.
- After protecting capital in Q1, we increased positions in companies like Starbucks and ServiceNow at attractive valuations in Q2. Our new investment in Idexx Labs (IDXX) has already gained 34% since purchase. The Portfolio remains fully invested in high-quality businesses that we view as positioned for mid-teens or better long- term earnings growth.
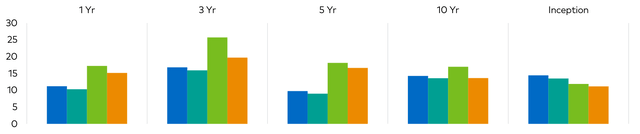
Seeks Growth & Capital Preservation (Performance (%) as of 6-30-2025)
|
Qtr |
YTD |
1 Yr |
3 Yr |
5 Yr |
10 Yr |
Inception^ (1-1-1989) |
|
|
Polen Focus Growth (Gross) |
9.36 |
2.71 |
11.18 |
16.82 |
9.76 |
14.26 |
14.44 |
|
Polen Focus Growth (Net) |
9.15 |
2.32 |
10.29 |
15.90 |
8.98 |
13.58 |
13.48 |
|
Russell 1000 Growth |
17.84 |
6.09 |
17.22 |
25.73 |
18.13 |
17.00 |
11.86 |
|
S&P 500 |
10.94 |
6.20 |
15.16 |
19.69 |
16.63 |
13.63 |
11.14 |
|
The performance data quoted represents past performance and does not guarantee future results. ^The performance presented prior to April 1, 1992, is not in compliance with the GIPS Standards. Current performance may be lower or higher. Periods over one-year are annualized. Performance figures are presented gross and net of fees and have been calculated after the deduction of all transaction costs and commissions, and include the reinvestment of all income. Please reference the GIPS Report which accompanies this commentary. The commentary is not intended as a guarantee of profitable outcomes. Any forward-looking statements are based on certain expectations and assumptions that are susceptible to changes in circumstances. Opinions and views expressed constitute the judgment of Polen Capital as of the date herein, may involve a number of assumptions and estimates which are not guaranteed, and are subject to change. Contribution to relative return is a measure of a securities contribution to the relative return of a portfolio versus its benchmark index. The calculation can be approximated by the below formula, taking into account purchases and sales of the security over the measurement period. Please note this calculation does not take into account transactional costs and dividends of the benchmark, as it does for the portfolio. Contribution to relative return of Stock A = (Stock A portfolio weight (%) – Stock A benchmark weight (%)) x (Stock A return (%) – Aggregate benchmark return (%)). All company-specific information has been sourced from company financials as of the relevant period discussed. |
Commentary
With the calendar flipping from Q1 to Q2, the market environment shifted from extreme “risk-off” sentiment to the exact opposite— a historic V-shaped recovery characterized by increasing speculation and risk appetite. The market entered 2025 wholeheartedly, embracing the new administration’s pro-growth policy agenda, while simultaneously minimizing or altogether overlooking any potential tariff-related and valuation headwinds. With positioning completely offsides, the market quickly recalibrated risk, prompting a swift -23% drawdown (Exhibit 1) in the Index from mid-February through early April. The Portfolio declined 20% over the same period, providing 300 basis points of protection.
Exhibit 1: Russell 1000 Growth YTD Cumulative Total Return
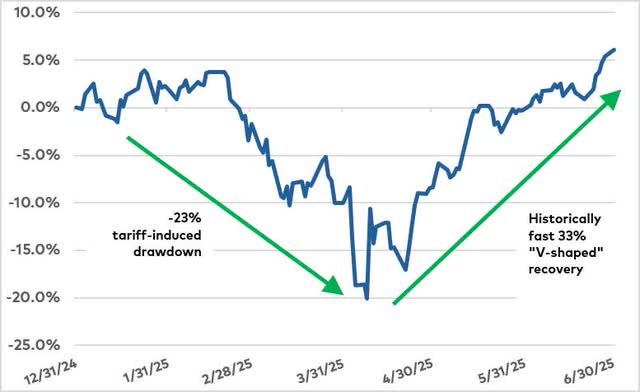
Source: Bloomberg
In the second quarter, as near-term market uncertainty around reciprocal tariffs dissipated, it set the stage for a +33% recovery rally—12% of which came on a single day (April 9). Notably, the rally was not broad-based, with less than 1/3 of Index constituents outperforming the overall return. Two connected themes largely defined the rally: AI leadership and high-beta cyclicals.
Semiconductors, the most obvious representation of AI leadership, were up +64% in 2Q off the April 8 lows. AI leadership also extended to AI-adjacent infrastructure segments like utilities, select software businesses, and pockets within industrials (electrical equipment, HVAC systems, aerospace/defense tech, etc.). The second defining theme of the 2Q rally—high-beta cyclicals—included the period’s best performers, many of which tend to fall in consumer discretionary categories.
For historical context, 2Q25 was in the top 5% of quarterly returns for the Index since 1978. Of further note, in only six quarters have returns shifted so dramatically vs. the prior quarter—all occurring amidst the late 1990s/early 2000s Tech Bubble era and more recently, the 2Q 2020 Covid-19 recovery.
This year’s extremes are laid bare when comparing manager performance from one quarter to the next. In 1Q, the best-performing managers exhibited the lowest beta relative to the Index. By contrast, in 2Q, the highest-beta managers delivered the strongest performance. To illustrate this reversal, top-quartile managers in 1Q averaged only the 81st percentile of the peer universe in 2Q. Conversely, the top-quartile managers in 2Q ranked, on average, just the 72nd percentile in 1Q.
This is not an environment in which we would expect to outperform. Over our 36-year history, we have constructed the Portfolio around a spectrum of high-quality growth businesses. At one end of the spectrum are stable compounders—companies that typically deliver steady, predictable, low double-digit earnings growth through good times and bad. At the other end are open-ended growth businesses attacking a large, expanding addressable market. We typically avoid highly cyclical businesses. We view this balance across the growth spectrum as an advantage, as it adds resilience to the portfolio and supports long-term compounding. In the current environment, however, factors like quality orientation, valuation discipline, and diversification (across both sectors and growth profiles) have proven to be a headwind rather than a tailwind.
Against this backdrop, Focus Growth delivered a 9.36% gross return (9.15% net of fees), underperforming the Index by -8.48%. Nearly all of this underperformance stemmed from having zero exposure to semiconductors, while the remainder was primarily attributable to our exposures in Health Care—one of the Index’s worst-performing sectors. Illustrating the extreme dynamics driving markets, 6 of our bottom 10 relative detractors in 2Q were among our top 10 relative contributors in 1Q. (Further performance discussion follows in the next section.)
Taking a step back, it’s essential to reconnect with our purpose. We aim to construct a portfolio designed to compound returns at a mid-teens rate, driven by the mid-teens earnings growth of the most competitively advantaged and financially superior businesses we can identify. Our approach is not about outsmarting the market or pursuing thematic or macroeconomic trends. Instead, our durable compounder approach is built to provide downside protection while enabling consistent long-term compounding.
By avoiding short-term narrative hype cycles and adhering to our disciplined investment process—focusing only on the highest- quality growth businesses—we have, over nearly 37 years since inception, achieved our objective: a 14.3% gross annualized return (13.4% net) on the back of mid-teens earnings growth. Net of fees, this equates to a greater than 100x return for investors who have been with us since inception.
While this long-term, quality-oriented approach helped protect the Portfolio vs. the Index in the first quarter, its more significant benefit is lending a degree of resilience, irrespective of what the future holds in this uncertain moment.
Portfolio Performance & Attribution
In the second quarter of 2025, the Portfolio returned 9.36% (gross of fees, 9.15% net of fees), compared to 17.84% for the Index and 10.94% for the S&P 500 Index (SP500, SPX). Top relative contributors to the Portfolio’s performance included Apple (sold early in the period), Oracle, and Netflix. The top absolute contributors were Oracle, Microsoft, and Amazon.
The largest relative detractors in the quarter were NVIDIA (not owned), Thermo Fisher Scientific, and Broadcom (not owned). The largest absolute detractors were UnitedHealth Group, Thermo Fisher Scientific, and Apple.
AI re-emerged as the dominant narrative, driving much of the market’s leadership in the second quarter. Oracle was our top- owned relative contributor, up 56% in the quarter (and 76% since the market bottom on April 9) as the market embraced a meaningful acceleration in growth driven by the Oracle Cloud Infrastructure (OCI) segment. The company appears to be in the early stages of a significant increase in revenue growth, fueled in part by its position as a go-to cloud infrastructure provider for training generative AI models.
This is only one facet of the investment thesis. Oracle has been successfully migrating enterprise software customers to the cloud and is, for the first time, able to bring its database clients to the cloud as well—creating a multi-pronged growth investment thesis.
As the air came out of many perceived “AI beneficiaries” amidst elevated tariff-related uncertainty in 1Q, we noted in our previous Quarterly Letter that this had pressured Oracle shares. We took advantage of this weakness by adding to our position in 1Q. Oracle is now one of our largest portfolio weightings.
Similarly, last quarter we highlighted some of our healthcare holdings as top contributors, given their defensive characteristics and reasonable valuations vis-a-vis solid earnings growth. While some of the sector’s weakness in 2Q was due to idiosyncratic factors (see our UnitedHealth profile below), healthcare as a whole was weak. This was primarily because: 1) defensives were less appealing to investors in a “risk-on” environment, and 2) the market was unwilling to look past near-term challenges facing the sector, such as tariffs and government funding cuts.
Portfolio Activity
In the second quarter, we initiated a new position in IDEXX Laboratories and eliminated our positions in Apple and UnitedHealth Group. We also added to our positions in Starbucks, ServiceNow, CoStar Group, and Adobe, and trimmed our position in Amazon.
IDEXX Labs is a global leader in pet diagnostics, offering in-clinic diagnostics (razor and razor blade consumables) and out-of-clinic reference labs. We have researched the business for two decades and admired its durable competitive advantages, highly recurring
and profitable business model, attractive runway, supported by tailwinds from pet ownership and the “humanization of pets,” and strong execution by its management team. IDEXX employs a successful “surround the customer” strategy by offering diagnostic tests across many modalities, along with imaging and veterinary practice management software. With a dominant market share in pet diagnostic tests, IDEXX continues to expand its addressable market by innovating new types of testing and creating additional revenue streams for its veterinary customers. We envision years of continued innovation and market expansion, with minimal competitive threats.
Historically, we questioned IDEXX’s persistently high valuation. However, the recent, transitory business slowdown—driven by fewer vet clinic visits as COVID-era pets remain relatively young— has made the valuation more attractive. We believe the company’s long-term outlook remains largely unchanged. As these pets approach 6-7 years of age, their vet care needs will increase, supporting our expectation for sustained double-digit organic revenue growth and mid-to-high teens EPS growth. Even with EPS growth at least in line with the portfolio average, we expect IDEXX to also exhibit safety-like characteristics due to its unique competitive position, recurring revenues, and loyal shareholder base.
We eliminated our position in Apple early in the quarter. As a reminder, our initial investment thesis on the company (which we added in July 2024) anticipated accelerating revenue and earnings growth driven by the launch of Apple Intelligence, which we expected to trigger a new iPhone upgrade cycle. Unfortunately, many of the most compelling Apple Intelligence features are significantly delayed, calling into question the timing of the reacceleration. Furthermore, tariffs present a predictable and persistent headwind, as most Apple products are made in China and shipped globally. Given these uncertainties and the presence of more attractive opportunities elsewhere, we felt it best to move on.
Finally, we exited our remaining small position in UnitedHealth Group (~1%). After years of continuous earnings growth and durability, the consistency we’ve come to expect from UNH has been fractured. The company reduced its earnings guidance twice recently, as medical costs have exceeded expectations in both the UnitedHealthcare (insurance) and Optum Health (medical practice) segments.
It is difficult to pinpoint a single cause for this divergence as a large, scaled business like UNH should typically have strong visibility into medical cost trends among its members. That said, it appears the company may have pursued new members and revenue growth too aggressively, underestimating the cost of serving these new members, which led to significant margin compression. At the same time, the federal government has reduced the number of diagnosis codes eligible to be risk-adjusted (eligible for higher reimbursement due to complexity). While we expect the business can overcome these issues in a relatively short time frame, the future growth profile could be lower than we expected. The complexity and pace of recovery around these issues are not easily determined. Given our small position and lack of conviction to increase the weighting—even at the lower stock price—we decided to reallocate to a better opportunity in our existing holding, Adobe.
Increases in Adobe, Starbucks, and CoStar Group reflect our expectation that each will see accelerating revenue and earnings growth in the coming year. Adobe will be lapping its pricing changes, which have been a headwind, and should begin to monetize its generative AI offerings. Starbucks’ turnaround plan is in motion, and we anticipate margins will bottom this quarter and improve from there. For CoStar, we expect its large investment in the residential real estate marketplace (Homes.com) to start bearing fruit, supported by a growing and increasingly effective dedicated sales force.
We increased our position in ServiceNow after its shares fell by over 30% since our valuation-driven trim just one quarter earlier. Amazon remains our largest position, though we trimmed its weighting back from double-digit levels, aligning it more closely with its expected return following strong appreciation over the last two years.
Outlook
After protecting capital in the first quarter, we were able to nimbly increase our positions in companies like Starbucks and ServiceNow at attractive valuations in 2Q. Our new position in Idexx Labs has already appreciated 34% since purchase through the end of the quarter. The Portfolio remains fully invested in highly competitively advantaged businesses that we expect to drive mid-teens or better earnings growth over the long term. While many focus myopically on the Magnificent 7 companies—a grouping we believe oversimplifies the differences among those businesses—we are excited to invest across a spectrum of durable growth opportunities, many of which we see as the next generation of great growth businesses. Some were great businesses of the past, like Oracle, that are now on new, accelerating growth paths, not unlike Microsoft over the last decade. Others, like Shopify (SHOP), are enabling commerce in new and inventive ways.
Thank you for your interest in Polen Capital and the Focus Growth strategy. Please feel free to contact us with any questions or comments.
Sincerely,
Dan Davidowitz and Damon Ficklin
|
Important Disclosures & Definitions: Disclosure: This commentary is very limited in scope and is not meant to provide comprehensive descriptions or discussions of the topics mentioned herein. Moreover, this commentary has been prepared without taking into account individual objectives, financial situations or needs. As such, this commentary is for informational discussion purposes only and is not to be relied on as legal, tax, business, investment, accounting or any other advice. Recipients of this commentary should seek their own independent financial advice. Investing involves inherent risks, and any particular investment is not suitable for all investors; there is always a risk of losing part or all of your invested capital. No statement herein should be interpreted as an offer to sell or the solicitation of an offer to buy any security (including, but not limited to, any investment vehicle or separate account managed by Polen Capital). Recipients acknowledge and agree that the information contained in this commentary is not a recommendation to invest in any particular investment, and Polen Capital is not hereby undertaking to provide any investment advice to any person. This commentary is not intended for distribution to, or use by, any person or entity in any jurisdiction or country where such distribution or use would be contrary to local law or regulation. Unless otherwise stated in this commentary, the statements herein are made as of the date of this commentary and the delivery of this commentary at any time thereafter will not create any implication that the statements are made as of any subsequent date. Certain information contained herein is derived from third parties beyond Polen Capital’s control or verification and involves significant elements of subjective judgment and analysis. While efforts have been made to ensure the quality and reliability of the information herein, there may be limitations, inaccuracies, or new developments that could impact the accuracy of such information. Therefore, this commentary is not guaranteed to be accurate or timely and does not claim to be complete. Polen Capital reserves the right to supplement or amend these slides at any time, but has no obligation to provide the recipient with any supplemental, amended, replacement or additional information. Any statements made by Polen Capital regarding future events or expectations are forward-looking statements and are based on current assumptions and expectations. Such statements involve inherent risks and uncertainties and are not a reliable indicator of future performance. Actual results may differ materially from those expressed or implied. The Russell 1000® Growth Index is a market capitalization weighted index that measures the performance of the large-cap growth segment of the U.S. equity universe. It includes Russell 1000® Index companies with higher price-to-book ratios and higher forecasted growth values. The index is maintained by the FTSE Russell, a subsidiary of the London Stock Exchange Group. The S&P 500® Index is a market capitalization weighted index that measures 500 common equities that are generally representative of the U.S. stock market. The index is maintained by S&P Dow (DOW) Jones Indices. The performance of an index does not reflect any transaction costs, management fees, or taxes. It is impossible to invest directly in an index. Past performance is not indicative of future results. Source: All data is sourced from Bloomberg unless otherwise noted. All company-specific information has been sourced from company financials as of the relevant period discussed. Definitions: Tech Bubble: the period between the late 1990s and early 2000s when the stock market saw a rapid increase in the valuations of internet-based companies. Magnificent 7: a term popularized to describe a set of the most dominant U.S. stocks, largely focused in the technology sector. The names that comprise the Magnificent 7 are Microsoft Corp (MSFT). (MSFT), Amazon.com Inc. (AMZN), Meta Platforms (META) Inc. (META), Apple Inc (AAPL). (AAPL), Alphabet ((GOOG,GOOGL)) Inc (GOOG,GOOGL). (GOOG), Nvidia (NVDA) Corp. (NVDA), Tesla (TSLA) Inc. (TSLA). Headwind: refers to factors or conditions that can impede the performance or growth of investments, sectors, or entire economies. These obstacles could be economic, political, or market-related and can affect investment returns negatively. Tailwind: refers to favorable conditions or factors that can propel asset prices or financial markets upwards. These can include economic growth, technological advancements, regulatory changes, or other external influences that enhance the performance of investments. Contribution to relative return: a measure of a security’s contribution to the relative return of a portfolio versus its benchmark index. The calculation can be approximated by the below formula, taking into account purchases and sales of the security over the measurement period. Please note this calculation does not take into account transactional costs and dividends of the benchmark, as it does for the portfolio. Contribution to relative return of Stock A = (Stock A portfolio weight (%) – Stock A benchmark weight (%)) x (Stock A return (%) – Aggregate benchmark return (%)). All company-specific information has been sourced from company financials as of the relevant period discussed. GIPS Report Polen Capital Management Focus Growth Composite—GIPS Composite Report
Performance % as of 12-31-2024: (Annualized returns are presented for periods greater than one year)
Total assets and UMA assets are supplemental information to the GIPS Composite Report. While pitch books are updated quarterly to include composite performance through the most recent quarter, we use the GIPS Report that includes annual returns only. To minimize the risk of error we update the GIPS Report annually. This is typically updated by the end of the first quarter. GIPS Report The Focus Growth Composite created on January 1, 2006 with inception date April 1, 1992 contains fully discretionary large cap equity accounts that are not managed within a wrap fee structure and for comparison purposes is measured against the S&P 500 and the Russell 1000 Growth indices. Effective January 2022, fully discretionary large cap equity accounts managed as part of our Focus Growth strategy that adhere to the rules and regulations applicable to registered investment companies subject to the U.S. Investment Company Act of 1940 and the Polen Focus Growth Collective Investment Trust were included in the Focus Growth Composite. The accounts comprising the portfolios are highly concentrated and are not constrained by EU diversification regulations. Polen Capital Management claims compliance with the Global Investment Performance Standards (GIPS®) and has prepared and presented this report in compliance with the GIPS standards. Polen Capital Management has been independently verified for the periods April 1, 1992 through December 31, 2023. A firm that claims compliance with the GIPS standards must establish policies and procedures for complying with all the applicable requirements of the GIPS standards. Verification provides assurance on whether the firm’s policies and procedures related to composite and pooled fund maintenance, as well as the calculation, presentation, and distribution of performance, have been designed in compliance with the GIPS standards and have been implemented on a firm-wide basis. The Focus Growth Composite has had a performance examination for the periods April 1, 1992 through December 31, 2023. The verification and performance examination reports are available upon request. Polen Capital Management is an independent registered investment adviser. Polen Capital Management maintains related entities which together invest exclusively in equity portfolios consisting of high-quality companies. A list of all composite and pooled fund investment strategies offered by the firm, with a description of each strategy, is available upon request. In July 2007, the firm was reorganized from an S-corporation into an LLC and changed names from Polen Capital Management, Inc. to Polen Capital Management, LLC. Results are based on fully discretionary accounts under management, including those accounts no longer with the firm. Effective January 1, 2022, composite policy requires the temporary removal of any portfolio incurring a client initiated significant net cash inflow or outflow of 10% or greater of portfolio assets, provided, however, if invoking this policy would result in all accounts being removed for a month, this policy shall not apply for that month. From July 1, 2002 through April 30, 2016, composite policy required the temporary removal of any portfolio incurring a client initiated significant cash outflow of 10% or greater of portfolio assets. The temporary removal of such an account occurred at the beginning of the month in which the significant cash flow occurred and the account re-entered the composite the first full month after the cash flow. The U.S. Dollar is the currency used to express performance. Certain accounts included in the composite may participate in a zero-commission program. Returns are presented gross and net of management fees and include the reinvestment of all income. Net of fee performance was calculated using either actual management fees or highest fees for fund structures. The annual composite dispersion presented is an asset-weighted standard deviation using returns presented gross of management fees calculated for the accounts in the composite the entire year. Policies for valuing investments, calculating performance, and preparing GIPS Reports are available upon request. The separate account management fee schedule is as follows: Institutional: Per annum fees for managing accounts are 75 basis points (.75%) on the first $50 Million and 55 basis points (.55%) on all assets above $50 Million of assets under management. HNW: Per annum fees for managing accounts are 150 basis points (1.5%) of the first $500,000 of assets under management and 100 basis points (1.0%) of amounts above $500,000 of assets under management. Actual investment advisory fees incurred by clients may vary. The per annum fee schedule for managing the Polen Growth Fund, which is included in the Focus Growth Composite, is 85 basis points (.85%). The total annual fund operating expenses are up to 125 basis points (1.25%). As of 9/1/2024, the mutual fund expense ratio goes up to 1.21%. This figure may vary from year to year. The per annum all-in fee* schedule for managing the Polen Focus Growth Collective Investment Trust, which is included in the Focus Growth Composite, goes up to 60 basis points (.60%). The per annum all-in fee* schedule for managing the Polen Capital Focus Growth Fund, which is included in the Focus Growth Composite, goes up to 65 basis points (.65%). *The all-in fee (which is similar to a total expense ratio) includes all administrative and operational expenses of the fund as well as the Polen Capital management fee. Past performance does not guarantee future results and future accuracy and profitable results cannot be guaranteed. Performance figures are presented gross and net of management fees and have been calculated after the deduction of all transaction costs and commissions. Polen Capital is an SEC registered investment advisor and its investment advisory fees are described in its Form ADV Part 2A. The advisory fees will reduce clients’ returns. The chart below depicts the effect of a 1% management fee on the growth of one dollar over a 10 year period at 10% (9% after fees) and 20% (19% after fees) assumed rates of return. The Russell 1000® Growth Index is a market capitalization weighted index that measures the performance of the large-cap growth segment of the U.S. equity universe. It includes Russell 1000® Index companies with higher price-to-book ratios and higher forecasted growth values. The index is maintained by the FTSE Russell, a subsidiary of the London Stock Exchange Group. The S&P 500® Index is a market capitalization weighted index that measures 500 common equities that are generally representative of the U.S. stock market. The index is maintained by S&P Dow Jones Indices. It is impossible to invest directly in an index. The performance of an index does not reflect any transaction costs, management fees, or taxes. The information provided in this document should not be construed as a recommendation to purchase or sell any particular security. There is no assurance that any securities discussed herein will remain in the composite or that the securities sold will not be repurchased. The securities discussed do not represent the composites’ entire portfolio. Actual holdings will vary depending on the size of the account, cash flows, and restrictions. It should not be assumed that any of the securities transactions or holdings discussed will prove to be profitable, or that the investment recommendations or decisions we make in the future will be profitable or will equal the investment performance of the securities discussed herein. A complete list of our past specific recommendations for the last year is available upon request.
GIPS® is a registered trademark of CFA Institute. CFA Institute does not endorse or promote this organization, nor does it warrant the accuracy or quality of the content contained herein. |
|||||||||||||||||||||||||||||||||||||||||||||||||||||||||||||||||||||||||||||||||||||||||||||||||||||||||||||||||||||||||||||||||||||||||||||||||||||||||||||||||||||||||||||||||||||||||||||||||||||||||||||||||||||||||||||||||||||||||||||||||||
Original Post
Editor’s Note: The summary bullets for this article were chosen by Seeking Alpha editors.
Read the full article here