


This article series aims at evaluating ETFs (exchange-traded funds) regarding past performance and portfolio metrics. Reviews with updated data are posted when necessary.
AIRR strategy
First Trust RBA American Industrial RenaissanceTM ETF (NASDAQ:AIRR) started investing operations on 3/10/2014 and tracks the Richard Bernstein Advisors American Industrial Renaissance® Index. It has 59 holdings, a 30-day SEC yield of 0.17% and a total expense ratio of 0.70%. Distributions are paid quarterly.
The fund implements a thematic strategy focused on the domestic economy through small and mid-cap companies of the industrial sector, and to a lesser extent of the banking industry. As described by First Trust, eligible companies must be in the Russell 2500 Index and directly related to manufacturing, infrastructure, and banking. Moreover, they must have non-U.S. sales inferior to 25% and positive 12-month forward earnings estimates. Bank stocks are selected in states of traditional manufacturing hubs, and their aggregate weight is limited to approximately 10% of asset value. All constituents are capped at 4% on rebalancing. The index is rebalanced on a quarterly basis. The portfolio turnover rate was 48% in the most recent fiscal year.
AIRR portfolio
The fund is exclusively invested in U.S. companies, mostly in small and micro caps (about 85% of asset value). As of writing, 89.8% of asset value is in industrials and 10.2% in banks. Therefore, this article will use as a benchmark the Invesco S&P SmallCap Industrials ETF (PSCI), which tracks the performance of industrial stocks in the S&P 600 Small Cap Index.
The heaviest industry in the portfolio is Construction & Engineering (44% vs. 7% in PSCI), followed by Machinery (28% vs. 27% in PSCI) and Electrical Equipment (13% vs. 2% in PSCI).
AIRR industry breakdown (Chart: author; data: Fidelity)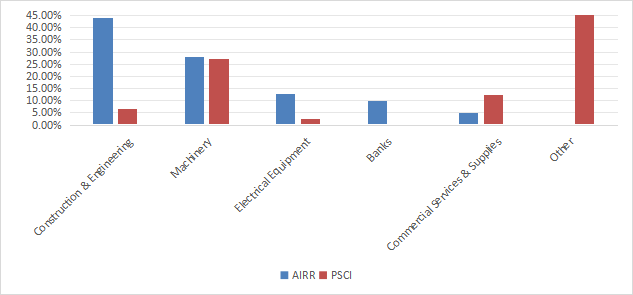
The top 10 holdings, listed in the next table, represent 30.5% of asset value and the top names weigh about 3%. Therefore, risks related to individual companies are moderate.
|
Ticker |
Name |
Weight% |
EPS growth%TTM |
P/E ttm |
P/E fwd |
Yield% |
|
PRIM |
Primoris Services Corp. |
3.14% |
4.57 |
20.80 |
17.25 |
0.44 |
|
MDU |
MDU Resources Group, Inc. |
3.11% |
27.37 |
11.39 |
16.66 |
1.88 |
|
BWXT |
BWX Technologies, Inc. |
3.06% |
5.15 |
37.82 |
32.81 |
0.92 |
|
MLI |
Mueller Industries, Inc. |
3.06% |
-16.46 |
12.91 |
14.11 |
1.24 |
|
MSM |
MSC Industrial Direct Co., Inc. |
3.05% |
-19.77 |
16.36 |
17.39 |
3.94 |
|
HII |
Huntington Ingalls Industries, Inc. |
3.04% |
25.11 |
15.00 |
16.15 |
1.95 |
|
CLH |
Clean Harbors, Inc. |
3.02% |
-14.31 |
33.83 |
31.08 |
0 |
|
GVA |
Granite Construction, Inc. |
3.02% |
-72.51 |
140.08 |
16.90 |
0.79 |
|
AIT |
Applied Industrial Technologies, Inc. |
3.00% |
11.94 |
21.73 |
21.55 |
0.71 |
|
HUBB |
Hubbell, Inc. |
2.96% |
32.47 |
28.29 |
23.26 |
1.29 |
Fundamentals
AIRR is a bit pricier than PSCI regarding valuation ratios (except price/earnings). It also shows superior sales growth and cash flow growth rates, as reported in the next table.
|
AIRR |
PSCI |
|
|
P/E TTM |
18.88 |
18.9 |
|
Price/Book |
2.53 |
1.96 |
|
Price/Sales |
1.27 |
0.96 |
|
Price/Cash Flow |
10.88 |
9.53 |
|
Earnings growth |
24.60% |
25.09% |
|
Sales growth % |
10.02% |
7.18% |
|
Cash flow growth % |
30.03% |
12.98% |
In my ETF reviews, risky stocks are companies with at least 2 red flags among bad Piotroski score, negative ROA, unsustainable payout ratio, bad or dubious Altman Z-score, excluding financials and real estate where these metrics are unreliable. With this assumption, 7 stocks out of 59 are risky in the portfolio, and they weight only 8.2% asset value, which is a good point. However, keep in mind that 10% of the portfolio (banks) is not considered by this number. According to my calculation of aggregate quality metrics (reported in the next table), portfolio quality is close to the S&P 500.
|
AIRR |
SPY |
|
|
Altman Z-score |
4.36 |
3.74 |
|
Piotroski F-score |
5.96 |
5.99 |
|
ROA % TTM |
7.37 |
7.17 |
Performance
Since inception, AIRR has outperformed not only PSCI, but also the large cap industrial benchmark Industrial Select Sector SPDR ETF (XLI), as plotted on the chart below. Nonetheless, it was lagging until 2020.
AIRR vs PSCI, XLI, total return since inception (Seeking Alpha)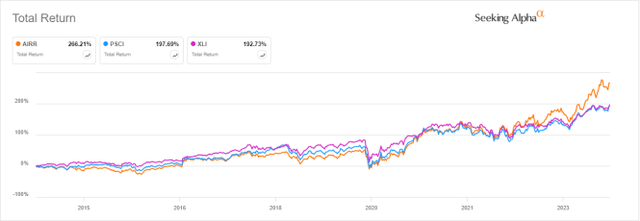
AIRR beats PSCI by 10% over the last 12 months:
AIRR vs PSCI, XLI, last 12 months (Seeking Alpha)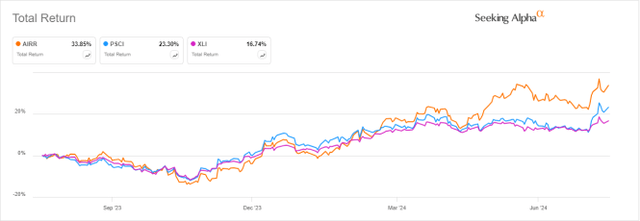
Competitors
The next table compares characteristics of AIRR and two strategy ETFs in industrials:
- Invesco Dorsey Wright Industrials Momentum ETF (PRN)
- Tema American Reshoring ETF (RSHO).
|
AIRR |
PRN |
RSHO |
|
|
Inception |
3/10/2014 |
10/12/2006 |
5/10/2023 |
|
Expense Ratio |
0.70% |
0.60% |
0.75% |
|
AUM |
$1.36B |
$232.40M |
$91.49M |
|
Avg Daily Volume |
$13.96M |
$1.32M |
$1.64M |
|
Number of Holdings |
62 |
46 |
33 |
|
Assets in Top 10 |
30.51% |
36.85% |
44.07% |
AIRR is the largest in asset value and the most liquid in dollar volume. The next chart plots 12-month total returns. AIRR is the best performer, shortly ahead of PRN.
AIRR vs competitors, 12-month return (Seeking Alpha)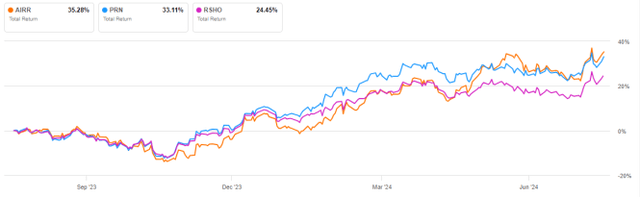
AIRR also beats PRN since its inception in 2014, although the gap has been created in the past 3 years.
AIRR vs PRN, since inception (Seeking Alpha)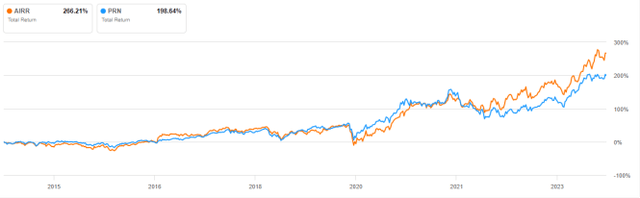
Takeaway
First Trust RBA American Industrial RenaissanceTM ETF focuses on small industrial companies whose sales are at least 75% in the U.S. It also invests about 10% of assets in community banks based around manufacturing hubs. Compared to a small cap industrial benchmark, AIRR is more concentrated in construction, engineering and electrical equipment. It is superior to the benchmark regarding cash flow growth and total return since inception.
The fund’s strategy and track record are attractive for investors seeking a fund focused on the traditional domestic economy. Nonetheless, it can’t avoid the geopolitical risks related to supply chains. Most companies are sourcing some supplies in Asia, especially in China and Taiwan.
Read the full article here