


Investment Thesis
The Invesco Zacks Mid-Cap ETF (NYSEARCA:CZA) holds 100 mid-cap stocks based on a company’s short interest, making it an exciting alternative to plain vanilla funds. However, exciting doesn’t always mean better, and my analysis reveals CZA’s selections have relatively poor earnings momentum, which is counter to Zacks Investment Research’s “raison d’être.” In addition, while its long-term performance record is somewhat acceptable, its 0.72% expense ratio is not, so I’m limiting my rating on CZA to a “hold” and will compare it with four low-cost alternatives you might find more suitable.
CZA Overview
Strategy Discussion
CZA tracks the Zacks Mid Cap Core Index, selecting stocks according to the following criteria per its methodology document.
- Excludes all Canadian stocks.
- Market caps between the 7-25 percentile of remaining universe.
- 20% of remainder eliminated based on high long-term earnings growth.
- 10% of remainder eliminated based on high P/E ratios.
- 100 stocks selected with the lowest short interest.
- Weighted based on company market cap.
- Reconstituted quarterly in March, June, September, and December.
Short interest is often used as a sentiment indicator. Companies with high short interest are said to have a “bearish” sentiment, though the opposite is not necessarily true. Low short interest, which is what the Index screens for, only means sentiment is not negative, and assuming it’s positive is where Zacks trips up. For example, PPG Industries (PPG) and Hartford Financial Services Group (HIG) are CZA’s #2 and #3 holdings. They have short interest as a percentage of shares outstanding figures of 1.12% and 1.48%, respectively, indicating there are few short sellers betting against them. However, they also have “D+” Seeking Alpha EPS Revision Grades. As support, consider the following earnings revision trends for PPG.
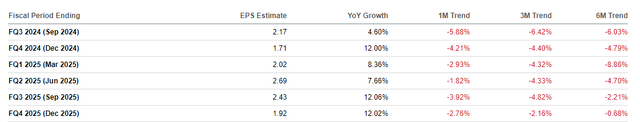
Seeking Alpha
This finding was disappointing because if you are familiar with Zacks Investment Research, you’ll know they pride themselves on leveraging the power of consensus forecasts to identify the best stocks. Even the linked methodology document reads:
Zacks Investment Research was formed in 1978 to compile and analyze brokerage research for both institutional and individual investors. The guiding principle behind the work is the belief that there must be good reason for brokerage firms to spend over a billion dollars a year to research stocks to recommend to their clients. Obviously, these investment experts know something special that may be indicative of the future direction of stock prices. Zacks was determined to unlock that secret knowledge and make it available to clients to help them improve their investment researches.
The Index’s short interest screen does not accomplish this goal, nor does its exclusion of high-growth and high P/E stocks. Instead, you’re asked to pay among the highest fees out of any mid-cap ETF on the market (#81/87) for a strategy with mixed long-term results. Let’s look at that next.
CZA Performance
The following table highlights CZA’s historical returns against its stated benchmark, the iShares Russell Mid-Cap ETF (IWR), from May 2007 to June 2024. I’ve also included the returns for the iShares Core S&P Mid-Cap ETF (IJH) and Vanguard Mid Cap ETF (VO).
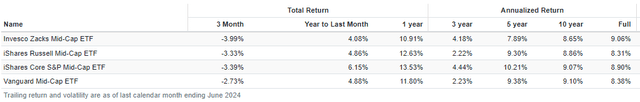
Portfolio Visualizer
CZA’s 9.06% annualized return since its inception is solid, outperforming its peers despite its high expense ratio. However, more recent returns are less impressive. Its 7.89% five-year annualized return lags behind IJH by 2.32%, which is mostly due to its lower growth profile. Consider these statistics:
- CZA outperformed this three-ETF composite in 11/16 years between 2008 and 2023.
- CZA outperformed by 10.53% in 2022 as high growth, high P/E stocks declined the most.
- CZA underperformed by 15.82% and 9.51% in 2020 and 2023 when high growth, high P/E stocks outperformed the most.
Furthermore, while CZA outperforms these benchmarks more frequently, it does so by a more narrow 3.50% margin compared to when it underperforms (6.63%). The takeaway is that while the strategy might work well in the long run, eliminating 20% of stocks with the highest earnings growth rates might do more harm than good.
CZA Analysis
Top Ten Holdings and Sector Exposures
CZA’s top ten holdings are listed below, totaling 21.18%. The Financials sector is well represented by Hartford Financial Services Group (HIG), Brown & Brown (BRO), and Willis Towers Watson (WTW). Meanwhile, Industrials is led by Westinghouse Air Brake Technologies (WAB) and Fortive (FTV).
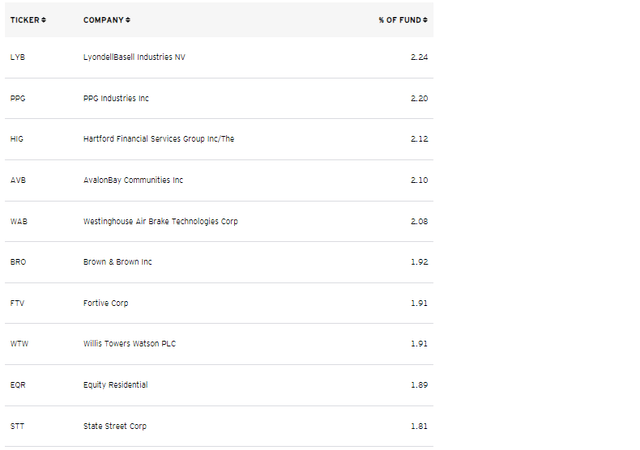
Invesco
I’ve highlighted these stocks because Financials and Industrials comprise 51% of the portfolio, an unusually high concentration for a “core” ETF. As shown below, other core mid-cap ETFs like IWR, IJH, VO, and the iShares Morningstar Mid-Cap ETF (IMCB) generally have maximum sector exposures of around 20%. Diversification is their strength, but for CZA, it’s a potential weakness due to its smaller number of holdings and lack of any sector allocation caps.
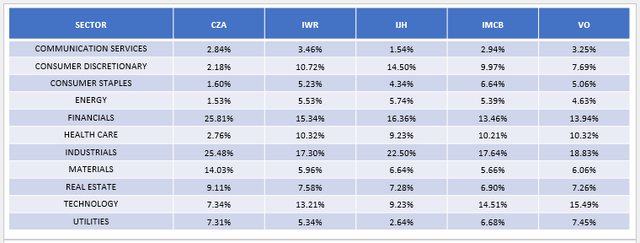
The Sunday Investor
These allocations will change, and CZA’s portfolio turnover rate over the last five years was between 118% and 162%, per its annual report. However, Financials and Industrials also comprised 52% of the fund as of April 30, 2024, and 46% as of October 31, 2023, per its semi-annual report. My records on July 26, 2022, show a 43% figure, so while portfolio turnover may be high, there are quite a few intra-sector changes. CZA shareholders should get used to this type of composition for the foreseeable future.
CZA Fundamentals By Sub-Industry
The next table highlights selected fundamental metrics for CZA’s top 25 sub-industries. I’ve also included summary metrics for IWR, IJH, IMCB, and VO at the bottom.
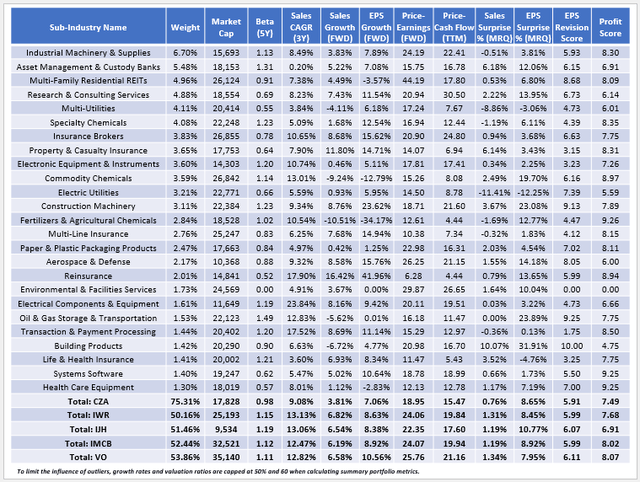
The Sunday Investor
Here are four observations to consider:
1. Profitability and size are positively correlated, which helps explain why CZA’s 7.49/10 sector-adjusted profit score, derived from individual Seeking Alpha Factor Grades. It’s slightly below IWR, IMCB, and VO, which hold larger stocks, but better than IJH, whose weighted average market cap is about half the size ($9.5 vs. $17.8 billion). The takeaway is that while CZA’s profitability isn’t necessarily better than its peers, it’s certainly not worse, so I rate it neutral on the quality factor.
2. One standout feature is CZA’s 0.98 five-year beta, which is much less than its peers and consistent with what we saw earlier in the performance analysis. It underperforms in strong bull markets like in 2020 and 2023 but hopefully makes up for it in market downturns like in 2022. The table shows that Research & Consulting stocks like Leidos Holdings (LDOS) contribute positively to CZA’s lower volatility, as do Insurance Brokers like Hartford Financial Services Group and Brown & Brown. In contrast, ETFs like IWR are heavier on volatile Financials stocks in the Regional Banks and Asset Management & Custody Banks sub-industries. I see CZA’s setup in Financials as an advantage, though I am concerned with its 26% allocation to this sector.
3. CZA’s lower growth profile is also evident when analyzing its growth and valuation metrics. For example, the portfolio offers just 3.81% estimated one-year sales growth compared to 6.82% for IWR and trades at a comparatively lower forward P/E (15.47x vs. 19.84x simple average, 15.86x vs. 17.95x harmonic average). This trade-off may be acceptable for more defensive investors, but it reinforces the argument that CZA will likely underperform in bull markets.
4. CZA’s sales surprise, earnings surprise, and earnings revision scores support my initial criticism that the strategy does not align with the objectives of Zacks Investment Research. These metrics are surprisingly sub-par, which indicates one or more of the following statements is true:
- low short interest does not indicate strong earnings sentiment.
- analysts are bullish on the high-growth stocks the Index eliminates.
- analysts are bullish on the high P/E stocks the Index eliminates.
All three statements may be accurate, but at least the first one is, and we need to look no further than Super Micro Computer (SMCI) as support. Per MarketBeat, SMCI’s short interest has steadily ticked up over the last two years, indicating it had no chance of being selected by CZA’s Index.
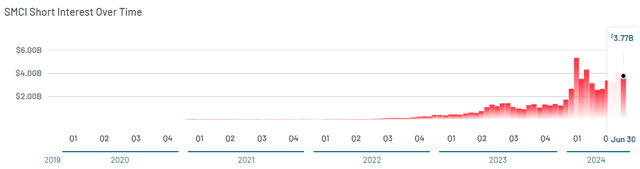
MarketBeat
However, SMCI has earned at least an “A-” Seeking Alpha EPS Revision Score since January 31, 2024. It’s also more than tripled IWR’s returns since then and is up over 153% in the last year alone. The takeaway is that sometimes high short interest is okay, especially if accompanied by strong earnings growth. The Index shouldn’t treat these features as automatic negatives.
Investment Recommendation
CZA is a mid-cap ETF that holds 100 stocks based on short interest after first screening out high growth and high P/E stocks. Its performance since May 2007 has been acceptable. It often outperformed its benchmark with more frequency, but substantially underperformed in the bull markets of 2020 and 2023. Conservative investors might find these trade-offs acceptable, even if its 0.72% expense ratio is not.
Still, I was disappointed to find a disconnect between the firm’s objective of leveraging consensus analyst earnings estimates and the Index screens. In particular, screening for low short interest does not improve sentiment, and depending on the market environment, neither does eliminating companies with high growth and high P/E ratios. Therefore, I’ve decided to rate CZA a “hold.” Thank you for reading, and I look forward to your comments below.
Read the full article here