

Copper Outlook
Let’s start with an orientation to the copper price. Here is the long-term, monthly log chart of London Metals Exchange (“LME”) copper with some of my channel lines included:
Barchart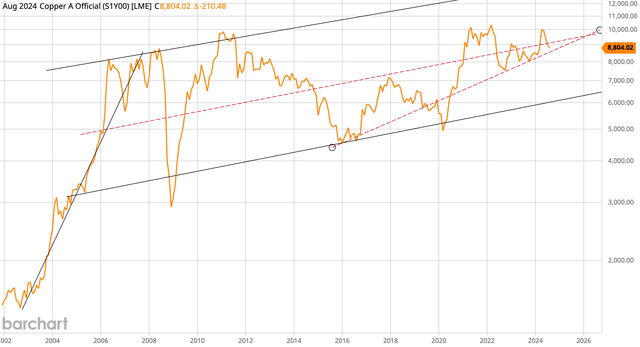
As I write, copper is at $4 per lb. ($8,820 per tonne). My price outlook essentially follows the red dotted line in the middle of this primary long-term monthly channel. I’m modeling $4.25 per lb. in 2024, $4.50 in 2025, $4.75 in 2026, and $5 in 2027 in company financial projections which includes my favorite miner with significant copper exposure—Glencore (OTCPK:GLNCY; OTCPK:GLCNF) which I recently wrote about here.
The above chart points to a move higher soon as the monthly price closes in on the lower trend line, which also reveals a likely continuation of the current longer-term bull market over the coming years. What is interesting is that a lot of monthly log commodity and commodity producer charts, such as Brent Crude, Glencore, and Exxon Mobil (XOM) (see below) are showing the same pattern—a multi-year period of sideways consolidation is hitting the long-term upward lower channel.
Brent Crude
Barchart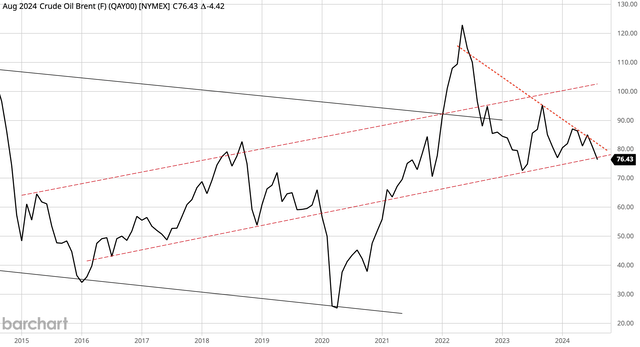
Glencore
Barchart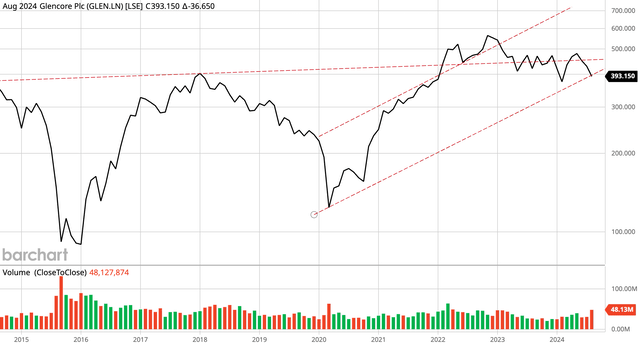
Exxon Mobil
Barchart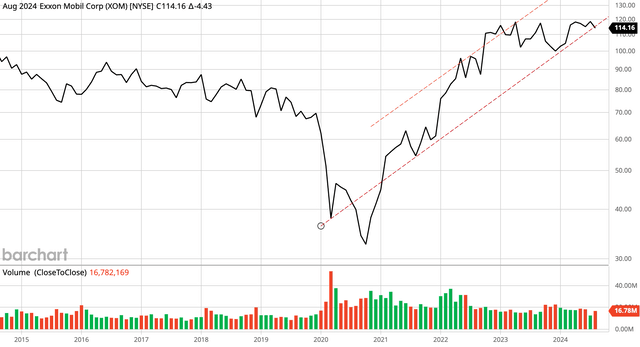
I love these monthly charts because they reflect the long-term trend of the market. I’ll initiate a buy or sell or hold based on one of these upper or lower channels over some (consensus) news article any day of the week. The takeaway on this section is that now is a good time to consider copper and copper miners.
Considering Freeport-McMoRan
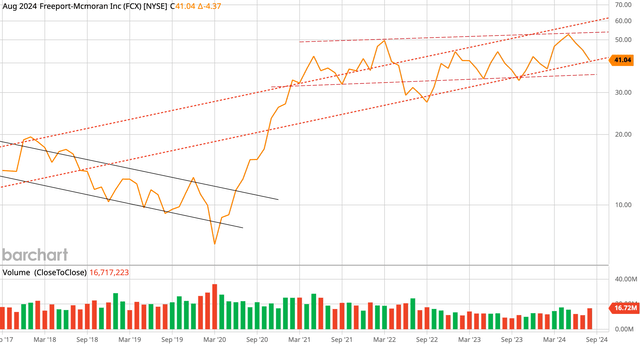
Freeport-McMoRan (NYSE:FCX) is the best pure play copper producer in the U.S. that you are going to find. Unsurprisingly, the monthly log chart is in the same position as copper, crude, and Glencore. Here are 2 monthly charts that show the very long-term (30 years) and the long-term (7 year) views. To be clear, the 2nd chart zooms in on the most recent years of the 1st chart.
Barchart Barchart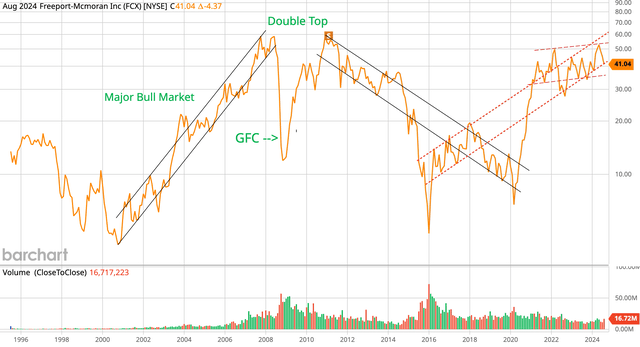
The 1st chart supports the view that we are in the latter phase of a multi-year consolidation within a longer term bull market. The current consolidation is similar to the late-2003 to 2005 stagnation period that preceded copper prices going to the moon before the Global Financial Crisis (GFC). What this could mean is that copper takes out $10 per lb. and FCX takes out $100 by the end of the decade.
More immediately, the 2nd chart supports the view that a near-term reversal higher is imminent unless an overwhelming force in the opposite direction appears soon. Current sentiment is weak and supportive of a contrarian move higher. The bullish narrative from earlier this year has been washed out, and a bunch of investors think the end is near because of a weaker jobs survey or whatever.
I like a particular aluminum producer even more than copper producers, but I’ll save that for another day. If copper is going to make a multi-year move higher and someday reach mania phase, then aluminum will do even better. The substitution of aluminum for copper in certain markets is real. Consider the following 10-year comparison chart of aluminum to copper.
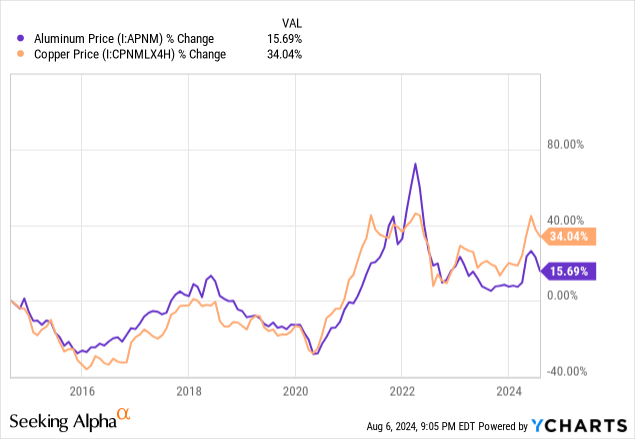
In recent years, copper has tended to trade for about 3 times the price of aluminum. When above this ratio, aluminum tends to catch up. When below this ratio, copper does better. Generally speaking, far more money could potentially be made in an aluminum producer if aluminum goes from $2,500 to $5,000 per tonne than in FCX if copper goes from $10,000 to $15,000 per tonne.
I’ve sidetracked into aluminum to hit the point that just because copper goes way up, doesn’t necessarily mean copper producers are the best option to make money. Still, FCX is highly correlated to copper and a go-to stock for traders who don’t know much about mining (many of them).
Freeport is producing about 4.2 billion lbs. of copper per year, however, they are producing about 5.6 billion lbs. on an equivalent basis, which means copper is about 75% of the profit mix. The rest comes from gold and molybdenum, which is also a great metal to have exposure to. Molybdenum is more valuable than copper and also looks poised for its next major move higher:
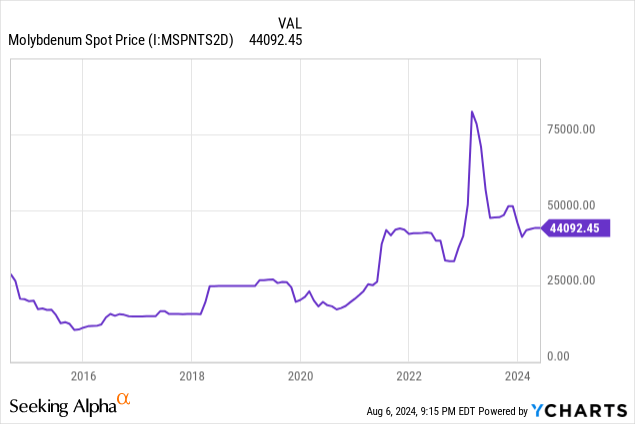
About 8.5% of Freeport’s revenue comes from moly when it is $50,000 per tonne.
At current metals prices, a good way to think of Freeport is about 75% copper, 8% moly, and 17% gold. Looking out a few years, gold production is set to decline, so the mix will be more like 78% copper, 9% moly, and 13% gold. One takeaway here: don’t buy FCX for gold exposure.
Premium Valuation
The problem with FCX is the obvious nature of it being the pure play copper stock for U.S. investors. It is trading for roughly 21 times my 2025 free cash flow per share estimate, which assumes $4.5 lb. copper, and 17.7 times 2025 Wall Street consensus earnings per share. Wall Street appears to be modeling significantly higher copper prices. I have a financial model for Freeport that adjusts revenues, earnings estimates, etc. when different metals prices are used. Using current gold and moly prices, I have to use $5.15 per lb. copper in my model to get to Wall Street consensus revenue and earnings projections. This is an aggressively bullish view on copper and a premium valuation for a mining company. If Doctor Copper has a PhD in economics (call me a skeptic), then I believe the 10-year yield could be 6% next year as the demand for loans tends to rise in strong interest rate environments. There is a lot baked into the price of FCX, with minimal dividend yield to compensate. There could just be some AI icing on this cake, as the “we are going to need a lot more copper to power AI” narrative seems to have taken hold.
Meanwhile, I have Glencore trading for 7.6 times 2025 free cash flow per share—almost 1/3 the price of FCX! This valuation gap is also reflected by the fact that Glencore’s dividend yield is roughly 3 to 4 times greater.
I have Freeport growing earnings and free cash flow at 14% annually looking out 5 years to 2029. Coupled with a Bullish outlook in my evaluation model, I get a 2025 target price of $31 using a forward multiple of 15 times free cash flow. My target is roughly 25% below the current share price. Again, there is a significant valuation premium in the share price in my view.
Concluding Thoughts – Key Risk Consideration
If you are bearish on the global economy, then you don’t want to own FCX. There would be a whole lot of pain for FCX shareholders if Wall Street shifts its copper outlook from $5.15 to sub-$4.00 per lb and the AI electricity theme gloss comes off. The shares could potentially fall significantly. This is not my view, but if you are going to go “long and strong” FCX, then you need to keep this premium valuation in mind. The greater the overvaluation, the greater the risk if things turn against you. Quite the opposite to this view though, I think we are at an inflection point that will see copper, oil, and the associated producers move higher. I’m negative on Freeport’s valuation, but the contrarian view on FCX’s monthly chart has a strong bullish setup.
Editor’s Note: This article discusses one or more securities that do not trade on a major U.S. exchange. Please be aware of the risks associated with these stocks.
Read the full article here