

Author’s Preamble
I have an actively managed investment portfolio, and I regularly trade stocks within my investing universe (or watch list) depending upon the stock’s price relative to my estimate of its intrinsic value and its market trading patterns (technical indicators).
I share my valuations with readers to get their feedback and to gain new insights from other knowledgeable investors.
It has been 6 years since I last looked at Chipotle (NYSE:CMG). At the time it was early days in the company’s recovery following another major food safety incident. At the time I thought that the path forward was not without significant risk, so I decided to focus my efforts on easier to value companies. Unfortunately, that was a mistake. CMG’s management have played an excellent game since then.
As the company’s share price has recently declined almost 20% from its peak, I thought that it was time to value the company once again. So let’s dig in.
Company Description
Chipotle (CMG) operates Chipotle Mexican Grill restaurants, which serve a focused menu of Mexican-style food with an emphasis on fresh, high quality raw ingredients prepared using classic cooking methods. The company operates 3,460 Chipotle restaurants throughout the USA, as well as 70 international Chipotle restaurants.
During Q2 FY2024 CMG opened its first licensed restaurant in Kuwait City. Except for this location, CMG has only wholly owned restaurants – there are no franchised operations.
The company manages its operations on a regional basis, but only has one reportable operating segment and provides no additional information about regional sales and profitability.
Business Overview
CMG competes in the Fast-Casual restaurant sector. Its strategy is to serve high quality food at reasonable prices with a focus on natural ingredients and animals that are raised or grown with care and with respect for the environment. CMG terms this approach as “Food with Integrity”.
The CMG operating model is quite different to many of its large competitors in so far as it does not have any franchised operations, and it owns very little real estate. A very high percentage of the restaurants are on leased sites.
Over the years CMG has suffered several serious food safety incidents (the largest incident was in December 2015) which resulted in a significant amount of negative publicity. As a result, CMG retooled many parts of its supply chain, spent significant amounts of capital upgrading restaurants, training staff and increasing its investment in marketing and promotion.
CMG has grown its sales over the last 10 years at a compound annual growth rate (CAGR) of 12% per year. Growth has been exclusively organic and has come from a combination of opening new sites and increased volume from existing sites. The company has opened on average 184 new restaurants every year over the last 10 years. The rate of new store openings has been stepped up since the COVID pandemic.
CMG’s Key Financial Levers
CMG’s growth in profitability is driven by:
- The rate of new store openings.
- Increasing same store sales through volume and price growth.
- Increasing operating margins through supply chain efficiencies and labor productivity.
The following chart shows the historical restaurant numbers and the growth rate in store numbers:
Author’s compilation using data from Chipotle’s 10-K filings.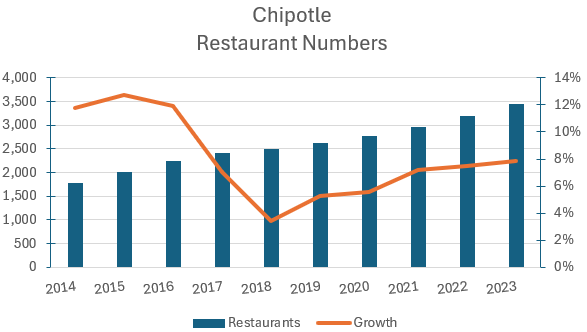
The dip in the store growth rate took place following a major food safety incident in December 2015. Since FY2018 CMG has been progressively increasing its rate of new store openings.
The following chart shows the average revenue generated per store and the reported same store revenue growth rate for the last 10 years:
Author’s compilation using data from Chipotle’s 10-K filings.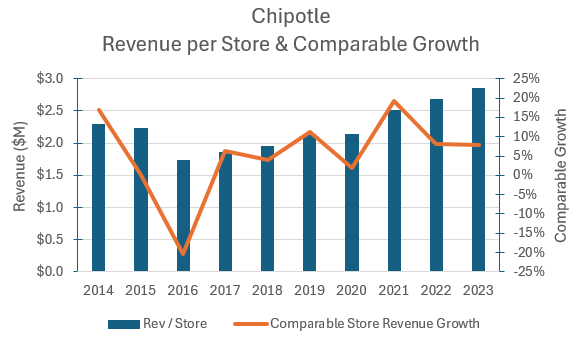
CMG clearly does an excellent job in finding new locations which can quickly achieve financial performance levels which match their established store network but the real power in the CMG brand is demonstrated by its ability to drive revenue growth (through both volume and price) from the existing store base.
CMG’s restaurant operating performance can be observed by looking at the historical restaurant margins:
Author’s compilation using data from Chipotle’s 10-K filings.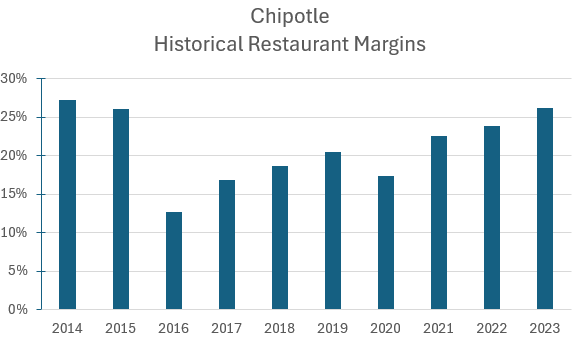
CMG’s restaurant margins bottomed in FY2016 following the food safety incident. Since then, CMG has done a great job driving efficiency through its supply chain and by increasing restaurant labor productivity. At the end of FY2023 restaurant margins were back to their historical peak.
Fast Casual Dining Market
The market is defined as a mixture of fast food and casual dining. Restaurants in this sector tend to offer the ease and convenience of fast food but with a more inviting sit-down experience.
The sector is very fragmented. The following table shows the historical revenues of the 21 largest companies in the sector worldwide for the last 5 years:
Author’s compilation using data from GuruFocus.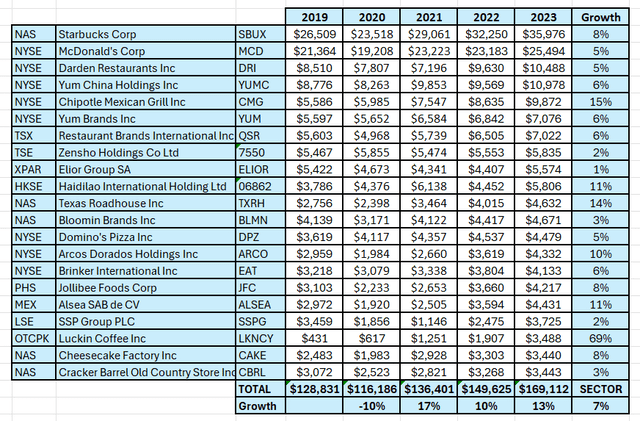
In FY2023 the largest companies in the sector had total revenues of $169 billion and the CAGR since FY2019 was 7%.
The table indicates that CMG is the sector’s fastest grower and is growing at double the sector average.
My estimate for the size of the sector is very close to the estimates provided by several market researchers. For instance, Strait Research believes that the sector’s revenues were $168 billion in FY2023 and they have forecast a sector CAGR of 6.6% for the next 8 years.
Chipotle’s Historical Financial Performance
Revenues and Adjusted Operating Margins
The following chart shows CMG’s reported sales and adjusted operating margins for the last 10 years:
Author’s compilation using data from Chipotle’s 10-K filings.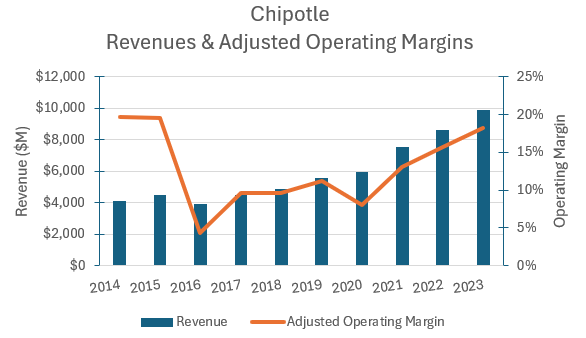
It should be noted that I have adjusted the reported operating income by eliminating the impact of extraordinary expenses, and the interest component embedded within the operating lease expense.
Due to CMG’s heavy reliance on the use of operating leases this has the effect of increasing margins by almost 2% relative to reported margins.
CMG’s operating margin has been increasing year on year since the COVID pandemic and is now close to its historic highs.
CMG has flagged that margins may have reached their seasonal high in the near term due to expected raw material price increases.
I estimate that the sector’s typical unadjusted operating margin is 7% and that CMG’s margin is currently in the sector’s highest decile.
Cash Flows
The following table summarizes CMG’s cash flows for the last 10 years:
Author’s compilation using data from Chipotle’s 10-K filings.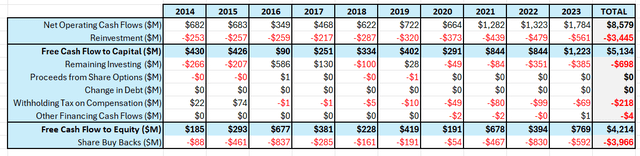
There are a few points to be made about this table:
- CMG has made no acquisitions. Its growth is entirely organic.
- CMG has never used leverage (debt) to expand its operations or return cash to shareholders.
- CMG does not pay dividends.
CMG’s operating model generates a lower proportion of free cash to revenue compared to some of its rivals (MCD and SBUX). This is due to the absence of a high margin franchise division.
Capital Structure
The following chart shows the history of CMG’s capital structure over the last 10 years:
Author’s compilation using data from Chipotle’s 10-K filings.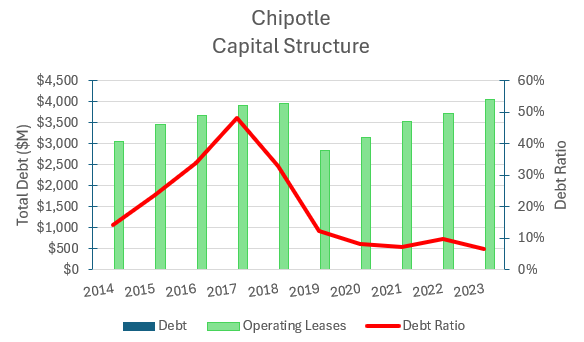
CMG is an unusual company. It is relatively old in years, but it still has the financial metrics of a growth company.
Consequently, CMG does not have any traditional debt on its balance sheet (it never has). A typical competitor has a debt ratio of 22%.
I suspect that as CMG’s revenue growth begins to taper, and the company enters the mature section of its life cycle then it will take on debt which can be used to retire some shareholders’ equity.
In the near term. CMG will pay the price of this structure with a higher cost of capital compared to its competitors.
Return on Invested Capital
The following chart shows the history of CMG’s return on invested capital (ROIC) over the last 10 years:
Author’s compilation using data from Chipotle’s 10-K filings.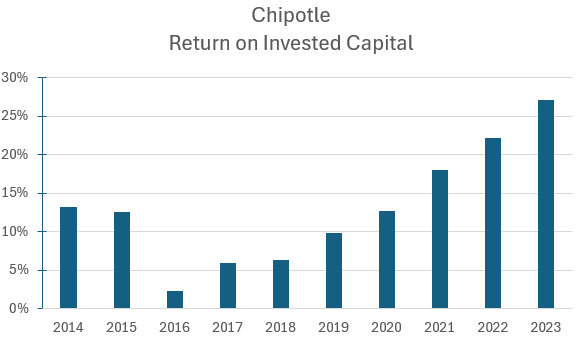
The ROIC has been steadily increasing since the food safety incident in FY2016. The typical sector ROIC is currently 8.3% and I estimate that CMG is in the sector’s highest quartile.
This is an excellent result and a tribute to management’s dedication to efficiently growing the business whilst only consuming modest amounts of capital.
My Investment Thesis for Chipotle
This report is being written 2 weeks after the publication of CMG’s 2nd quarter earnings.
At the end of Q2, CMG’s trailing 12-month (TTM) revenue was $10,663 M (14.9% higher than the previous 12 months) and the TTM operating margin was 17% (120 basis points higher than the previous 12 months).
The current consensus revenue forecast is projecting revenue growth of 14.9% for FY2024 and 13.7% for FY2025.
The current macroeconomic signals for the US are projecting a potentially slowing economy and lower inflation with several possible interest rate cuts expected over the next 12 months.
My scenario for CMG does not project any material changes in the way that the company operates. The vast majority of future growth is expected to come from the United States.
To date management has been able to grow the business mainly domestically. If the US growth was to slow it would not surprise me if CMG attempted to expand internationally using a franchise model. If this were to occur then this valuation would require revisiting.
Growth Story
The fast-casual dining sector has been growing revenues at 7% per year over the last 4 years and market researchers believe that this rate is sustainable for the next 8 years. CMG has been growing revenues at almost double the sector rate.
I suspect that a slowing economy may taper some of CMG’s near-term growth opportunities nevertheless I expect that CMG will comfortably exceed the sector’s forecast growth rate.
My scenario models a range of revenue growth from 7% to 13%. My base case is for 10% growth per year for the next 8 years, but I have also included a rate closer to the sector forecast of 7% and to CMG’s current rate of 13%.
Margin Story
CMG’s current margins have been expanding year on year since the end of the COVID pandemic and are now in the sector’s highest decile. Management has recently flagged that they expect margins to cyclically decline in the near term due to higher raw material costs.
It is possible that over the long run CMG’s margins can continue to expand but I suspect that this is a low probability. As a result of growing competition in a more difficult operating environment I have modelled operating margins to range between 15% and 19% (currently 18.3%). This still places CMG comfortably in the sector’s highest quartile.
Growth Efficiency
CMG’s reinvestment back into its business, unsurprisingly, has been growing in absolute terms but its capital efficiency has also been rising (more sales per investment dollar). I estimate that CMG’s current capital efficiency is similar to the sector’s median. I am not forecasting any change in this ratio and the model assumes sales per invested capital will be between 2.0 to 2.2.
Risk Story
Due to the lack of good data, it is difficult to forecast how CMG’s performance will be impacted by a more challenging economic environment.
Intuitively it might be expected that both growth and margins may be negatively impacted but perhaps CMG’s market position (great value with high convenience) might enable it to maintain most of its out-performance.
CMG is entering the next part of the economic cycle with a very strong balance sheet and no traditional debt. As growth eventually begins to slow, I would expect that CMG will take on additional gearing and my model provides for this.
CMG’s current cost of capital relative to its peers is high due to its low debt ratio but over time I expect that the cost of capital will decline back to the sector’s median. Compared to the general market, companies in this sector have a low cost of capital because of a relatively low beta (from the Capital Asset Pricing Model).
Competitive Advantages
CMG’s operating model generates superior financial outcomes compared to most of its competitors (high growth / high margins / high returns on capital). This would suggest that CMG has a strong competitive advantage. I suspect that this advantage is relatively intangible and linked to brand strength and management skills (unfortunately there is no patented intellectual property).
This type of competitive advantage is difficult to maintain over the long run therefore I suspect that CMG’s return on capital will decline over the long term but it will stay comfortably above its cost of capital.
Valuation Assumptions
The following table summarizes the key inputs into the valuation:
Author’s valuation inputs.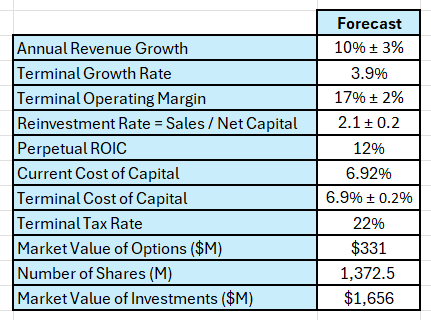
Discounted Cash Flow Output
The output from the DCF model is in $USD:
Author’s model. Author’s model.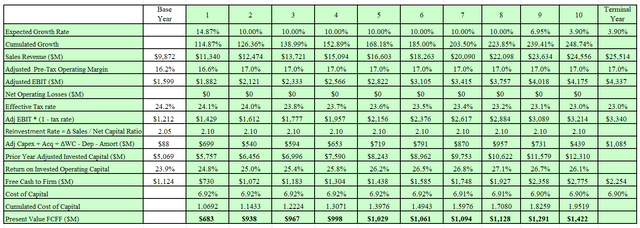
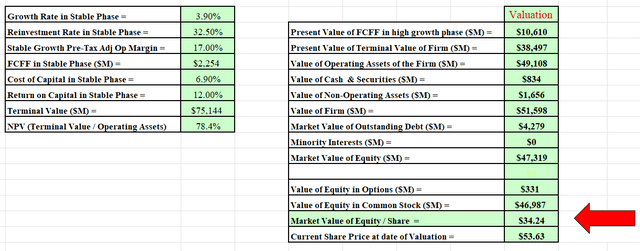
I also generated a Monte Carlo simulation for the valuation based on the range of inputs disclosed in the valuation input table (above). The output of the simulation was developed from 100,000 iterations:
Author’s valuation model.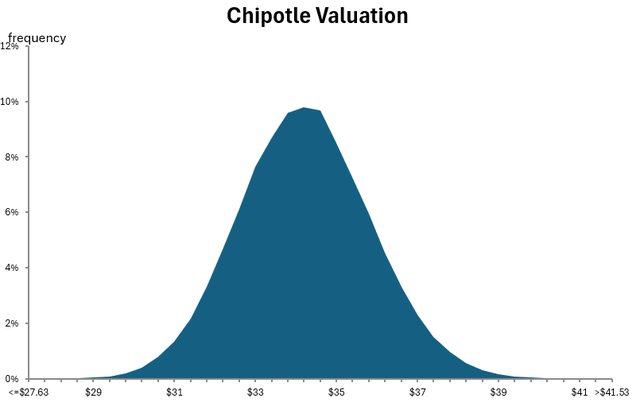
Based on my scenario, the simulation indicates that at a discount rate of 6.9%, CMG’s intrinsic value is between $27 and $42 per share with an expected value of $34.
CMG’s current market price at the time of writing this report was slightly above $54.
Based on my scenario, Chipotle is currently priced about 28% above the upper end of my valuation curve.
Final Recommendation
The report has highlighted that CMG has excellent fundamentals – it has been one of the fastest growers in the fast-casual dining sector for many years with high margins and high returns on capital.
What have been the returns to long-term shareholders?
CMG has been an excellent investment for many years as shown in the following table:
Author’s compilation using data from Yahoo Finance.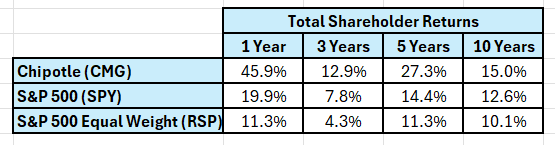
Over the past 12 months CMG shareholders have achieved an outstanding return on their investment. This is even more interesting considering that the share price peaked in June and has now declined by 28% since then.
What are insiders doing with their holdings?
Insiders often provide clues to investors about their perceptions of the share price relative to fair value through their personal share trading activities. The following table shows the reported CMG insider trades for FY2024:
Author’s compilation using data from GuruFocus.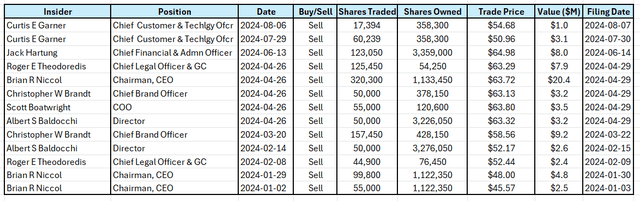
The data indicates that in recent times, insiders have been sellers of stock. Although we don’t know the reasons why individuals have been selling, we do know that insiders are not buying stock.
This may also be supportive of the view that the stock is overpriced.
Are there any clues from relative valuation metrics?
Many investors rely on relative valuation ratios to provide information regarding whether a stock is cheap or expensive. The following table compares CMG against its largest peers:
Author’s compilation using data from Yahoo Finance.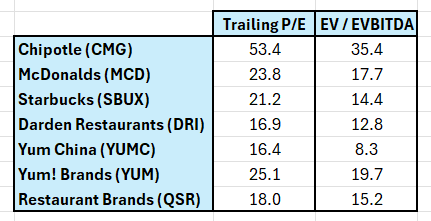
The data indicates that CMG’s relative valuation metrics are significantly higher than its peer group. Admittedly CMG has much higher revenue growth expectations than the other companies, but investors appear to be paying a full price for growth.
What does Seeking Alpha’s Quant Rating say?
The Seeking Alpha summary for CMG is as follows:
Seeking Alpha.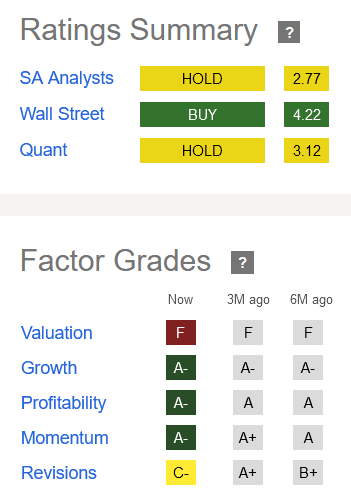
The Seeking Alpha factor grades agree with my assessment that CMG is currently significantly overpriced (and has been for some time).
In my investing world, I progressively take profits on any signs of market weakness when my stock’s market price significantly exceeds my valuation.
I note that the Seeking Alpha’s position summary is currently to HOLD and not sell.
What are the main risks to the CMG valuation going forward?
The Monte Carlo simulation identified that CMG’s valuation is particularly sensitive to changes in the operating margin and revenue growth.
I have projected that operating margins should continue to increase, and revenue growth should continue to be significantly higher than the sector’s forecast. My scenario is quite bullish for CMG but clearly the market is pricing in even higher levels of performance.
We can attempt to reverse engineer from the current market price what are the key valuation inputs that are required to create an intrinsic value equal to the share price. The following table shows the impact of changes in operating margin and revenue growth on the valuation’s mid-point:
Author’s model.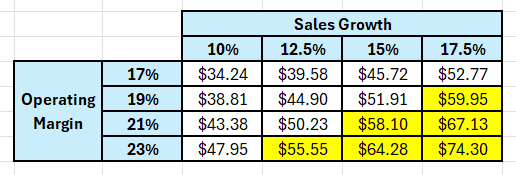
My model indicates that the market is currently pricing in a revenue growth of over 12.5% for the next 8 years with an operating margin above 19%.
I suspect that it is possible that CMG could achieve these higher growth levels, but I think that it is unlikely that operating margins can be increased above 19% without a significant change to a lower cost operating model (ruling out that competition would allow higher margins from higher prices).
Based on the available evidence I think that it is reasonable to conclude that at current levels CMG is overpriced and therefore my recommendation is that it is a SELL.
What should existing shareholders be doing?
CMG’s share price performance over the last year is an outlier compared to other companies in its sector. This can be seen in the following chart:
Author’s compilation using TradingView.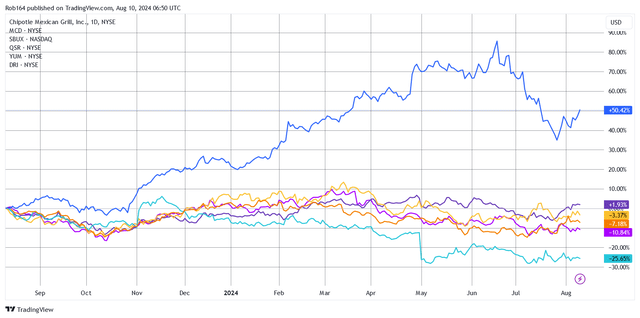
CMG’s share price has been falling for almost 2 months. There has been a small rally in the price over the last few days. I have no idea how long this rally will last but when it ends, I think that it would be a good time to SELL.
CMG is an excellent investment, and I will be waiting patiently for a lower price to buy into this company at some time in the future.
Read the full article here