


What a week! Or at least, what a Monday. Despite all the volatility, the S&P500 (SPY) closed back at 5344, just 2 points lower than the previous Friday. The big issue now is whether the bottom is in?
This week’s article will look at the technical evidence of a bottom (or lack of) provided by last week’s action. Various techniques will be applied to multiple timeframes in a top-down process which also considers the major market drivers. The aim is to provide an actionable guide with directional bias, important levels, and expectations for future price action.
S&P 500 Monthly
There is still a long way to go till the August close so we can’t make any firm conclusions, yet. At this point, a bearish bar is still present and a close above the July low of 5390 is needed to shift this neutral/bullish.
Notably, the low of 5119 was nowhere near any monthly references and major bottoms often happen near higher timeframe levels. The jury is out.
SPX Monthly (Tradingview)
The July low of 5390 is minor resistance. 5638 and the 5669 are major resistance points above that. At new highs, 5754 is the next potential target where there is a minor measured move. 6124 is a major measured move where the 2022-2024 rally is equal to the 2020-2021 rally.
Major support is at 4953-5000. 5265 failed to produce any reaction last week but is still a level to monitor.
The August bar will complete the upside Demark exhaustion count which is already having an effect.
S&P 500 Weekly
Monday’s open gapped below the major level of 5265 and bottomed at 5119. Why there? One of the reasons was the small weekly gap at 5127 from the week of 29th April. There was also a daily reference at 5115 which will be covered in the next section. These were not major, obvious levels, but clearly the drop was stretched enough and the conditions were suitable for a large bounce to develop.
The strong move off the low, close at the high of the weekly range and recovery back over the 20-week MA are all positives. That said, a lower low, lower high and lower close were also formed and cannot be considered bullish. Next week will be important in either confirming a reversal with a higher low, higher high and higher close over 5344, ideally 5400. Otherwise, it the view would remain bearish.
Three weeks ago, I pointed out the similarities between the pattern at the July highs and the pattern at the 2021 top. The two (highlighted) remain quite similar and the 4th week of the decline in early 2022 reversed sharply higher very much like this week’s action. A warning, perhaps, that any recovery could be temporary.
SPX Weekly (Tradingview)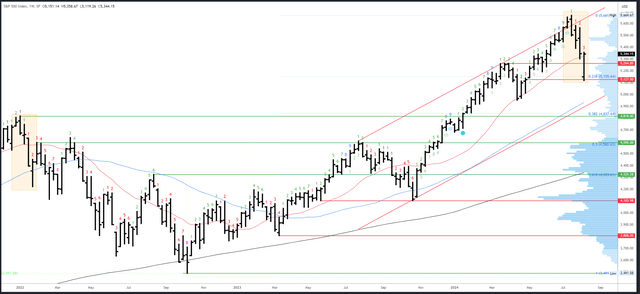
Resistance comes in at 5390-400 and 5566.
The 5127 gap fill and 5119 low are relevant, but major support is 4953-5000 which could line up with the 50-week MA and the channel low in the coming weeks.
A weekly upside Demark exhaustion signal has now completed and is having an effect. Next week will be bar 4 (of a possible 9) in a new downside count.
S&P 500 Daily
The S&P500 remains some way below the 20dma and 50dma which are about to cross over. This is a bearish signal but not one I pay too much attention to (look what happened in April and May).
The 200dma is down at 5032 and often acts as a magnet. Notably, the Nasdaq (QQQ) reversed from its 200dma on Monday (another reason why markets bottomed where they did). In theory, the weakest index always tests its 200dma first and this tends to lead to a temporary bounce before it breaks on the next drop. This allows the strongest index, in this case the S&P500, to test its 200dma.
Monday’s 5119 low was very near the 5115 measured move. We now have a 3-leg correction from the highs and this is potentially bullish.
SPX Daily (Tradingview)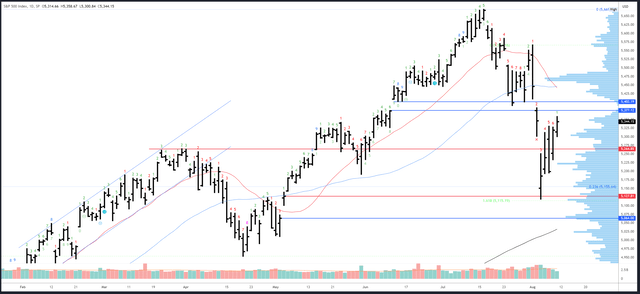
Key resistance is at 5390-400. Gap fill and the 50dma at 5446 are also potential resistance, then 5560-70. The 20dma will be dropping sharply and could meet up with any rally in the 5390-400 area.
On the downside, the gap at 5186-5199 is potential support, followed by 5119-27. Should the 5119 low be broken, expect a test of the 200dma which is at 5032 and rising. It may well line up with gap fill from the 2nd May at 5064.
An upside Demark exhaustion will be on bar 2 (of 9) on Monday which means there can be no exhaustion signal next week.
Drivers/Events
So much can be said about Monday’s drop, but the price action clearly told us it was an overreaction. Stock markets were bid as soon as the US session opened. Indeed, the crash happened overnight and mostly related to the USDJPY carry trade and the need for liquidity, hence the drop in Bitcoin in the early hours and the heavy selling in crowded trades like the “Mag 7” in the pre-market.
Thursday’s Unemployment Claims of 233K also suggested the market reaction was overdone. The US is not suddenly going to fall into a deep recession and the swing towards ultra dovish easing expectations from the Fed could be yet another mistake from the bond market. I was always told the bond market was the smart money, but it has been badly and obviously wrong several times already this year. I expect 4 cuts in 2024, but the pace of cuts could slow again in early 2025 if the economy remains relatively stable.
Inflation will be back in the spotlight next week with PPI on Tuesday and CPI on Wednesday. With volatility still high, the reactions could be large, but unless there is a major deviation from the expected CPI reading of 0.2%, the moves may well fade again. The Fed have apparently moved on from the fight against inflation and are now equally concerned with the labour market. CPI is therefore less important than it was.
Retail sales data and Unemployment Claims are due on Thursday and could actually overshadow inflation. 250K is the danger area for Claims and anything close could send stocks lower again.
Probable Moves Next Week(s)
Bigger picture, the view remains bullish and new highs are expected in H2. We are therefore correct to ask whether the bottom is in and if it is safe to buy again. The evidence, however, is patchy.
Monday’s crash was clearly an overreaction and the technical levels were logical for a bounce. Yet, despite the good recovery, a bearish weekly bar formed and the monthly bar remains in bearish territory. Furthermore, major levels were not tested and these could act as a “magnet” as higher timeframe buyers may patiently wait for them.
Shorter-term, due to the strong close on Friday there should be some follow through higher early next week. A move into the critical area of 5390-400 (5446 at a stretch) looks likely but could lead to a reversal back lower. A drop to 5186-99 initial support could then unfold, and if the S&P500 closes the week near the 5119 low, we can expect continuation to further lows towards the 5000 area to test the 200dma.
A weekly close above 5390 is key and would shift the view back positive.
Read the full article here