


Interior designer, Ethan Allen Interiors (NYSE:ETD) is a stock I have previously covered, and which continues to display very strong economics, with core profits compounding by over 45% a year, the firm generating economic earnings of $163.22 million and free cash flow of $389.15 million, and earnings rising returns on capital. Moreover, the firm’s free cash flow has a yield of 10.97%. Yet, the firm trades at a 23% discount to its intrinsic value.
What’s Changed and What Was My Thesis?
I am revisiting Ethan Allen simply because a quarter has passed since I last discussed the company, and its Q3 2024 results demanded that I update the inputs of my model.
My initial thesis was this: the business is straightforward to analyze, with net operating profit after tax (NOPAT) rising from $11.99 million in 2020 to $67.97 million in what was then the trailing twelve months (TTM), compounding at a rate of 41.48% a year. That was coupled with rising NOPAT margins, and rising invested capital turns, a measure of balance sheet efficiency. The sum of these two things was a rise in returns on invested capital from 1.8% in 2020 to 10.3% in that TTM. Ethan Allen’s free cash flow (FCF), meanwhile, had grown from $11.99 million to $24.07 million, for a cumulative FCF of $326.49 million, compared to a then-market capitalization of $698.06 million. That amounted to 46.77% of its market capitalization in the form of FCF. Not only was Ethan Allen generating lots of FCF, that FCF had an attractive yield of 3.02%. The company’s FCF generation made it a reliable source of future dividends. Despite all this, the company had been trading at a price below its intrinsic value, which I measure as “economic book value” (EBV), since 2021. This made the firm very attractive.
Since then, NOPAT has risen, along with NOPAT margins, although NOPAT margins have dipped from 1.1 to 1.09, and ROIC is up as well. The company’s ability to earn attractive economic earnings has grown. As an FCF generator, Ethan Allen is doing better than when I first wrote about it, and its yield is up to 10.97%. And yet, the gap between the market price and the value of the business is even bigger. Ethan Allen is more attractive than it was a quarter ago. Here are the details why.
GAAP Net Income Underestimates Core Profits
Ethan Allen has been consistently profitable over the last five years. However, the company’s GAAP net income still underestimates just how profitable the company has been. By stripping away the impact of non-recurring and non-core items, such as the $6.38 million in implied interest in capitalized leases that the company incurred in 2024. By doing this, we see that while GAAP net income grew from $8.9 million in 2020 to $63.82 million in 2024, compounding at 48.3% a year, the company’s Iron Wallet NOPAT has risen from $11.9 million to $78.75 million in 2024, compounding at 45.93% a year. While the compounding rate has been slower, the level of core profits is higher than GAAP net income reveals.
|
(Values in millions) |
2020 |
2021 |
2022 |
2023 |
2024 |
|
GAAP Net Income |
$ 8.90 |
$ 60.00 |
$ 103.28 |
$ 105.81 |
$ 63.82 |
|
Total Hidden Non-Operating Expense, Net |
$ 1.50 |
$ 0.04 |
$ 0.04 |
$ 0.04 |
$ 0.04 |
|
Reported Non-Operating Expense, Net |
$ (2.56) |
$ 3.28 |
$ (4.33) |
$ (7.55) |
$ 8.02 |
|
Total Derived Data for the Net Income to NOPAT Reconciliation |
$ 4.06 |
$ 3.20 |
$ 3.82 |
$ 7.18 |
$ 6.87 |
|
Change in Total Reserves |
$1.04 |
$0.24 |
-$0.69 |
-$0.17 |
$ 0.26 |
|
Goodwill Amortisation Expense, Net |
|||||
|
Employee Stock Options (ESO) Expense |
|||||
|
Implied Interest for PV of Capitalized Leases |
$ 7.36 |
$ 7.02 |
$ 6.42 |
$ 7.72 |
$ 6.38 |
|
Classification Disclosure Adjustment |
|||||
|
Non-Operating Tax Adjustment |
$ (4.34) |
$ (4.06) |
$ (1.92) |
$ (0.37) |
$ 0.23 |
|
Reported After-Tax Non-Operating Expense/(Income), Net |
$ – |
$ – |
$ – |
$ – |
$ – |
|
Reported Minority Interest Expense, Net |
|||||
|
Reported Loss/(Gain) from Discontinued Operations After-Tax, Net |
|||||
|
Reported Preferred Dividends, Net |
$ – |
$ – |
$ – |
$ – |
$ – |
|
Reported Dividends on Redeemable Preferred Stock, Net |
|||||
|
Reported Other After-Tax Charges, Net |
|||||
|
Net Operating Profit After Tax (NOPAT) |
$ 11.90 |
$ 66.52 |
$ 102.81 |
$ 105.48 |
$ 78.75 |
|
NOPAT margin |
2.02% |
9.71% |
12.57% |
13.33% |
12.19% |
Source: Company filings and author calculations
As NOPAT has risen, so too have NOPAT margins, which have grown from 2.02% in 2020 to 12.19% in 2024.
Capital Allocation is Working
Invested capital turns (revenue/average invested capital), a measure of balance sheet efficiency, has risen from 0.93 in 2020 to 1.06 in 2024. Ethan Allen has been able to earn more NOPAT while decreasing the size of its invested capital. The impact is obvious: return on invested capital (ROIC) has risen from 1.88% in 2020 to 12.94% in 2024.
In that time, Ethan Allen has failed to earn economic earnings ((ROIC-WACC)*invested capital) in just one year, 2020, when ROIC was lower than the company’s weighted average cost of capital (WACC). Since 2020, Ethan Allen has generated $163.22 million in economic earnings.
Source: Company filings and author calculations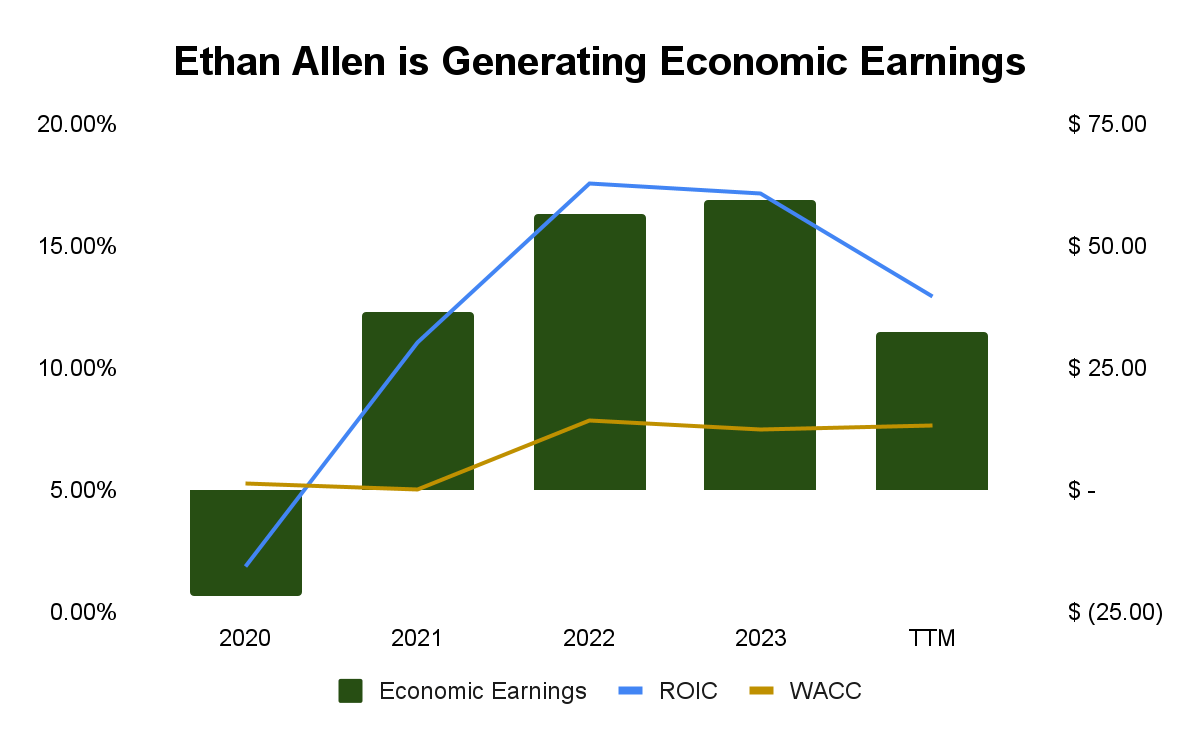
Strong Free Cash Flow Generation
Between 2020 and the TTM, Ethan Allen has earned $389.15 million in free cash flows (FCF), with FCF rising from $11.49 million in 2020 to $86.26 million in 2024. The 389.15 million generated amounts to 50.4% of its current market capitalization. Since 2021, FCF has been available at double-digit FCF yields (FCF/enterprise value) and that trend continues, with FCF yield at 10.97% in 2024.
Source: Company filings and author calculations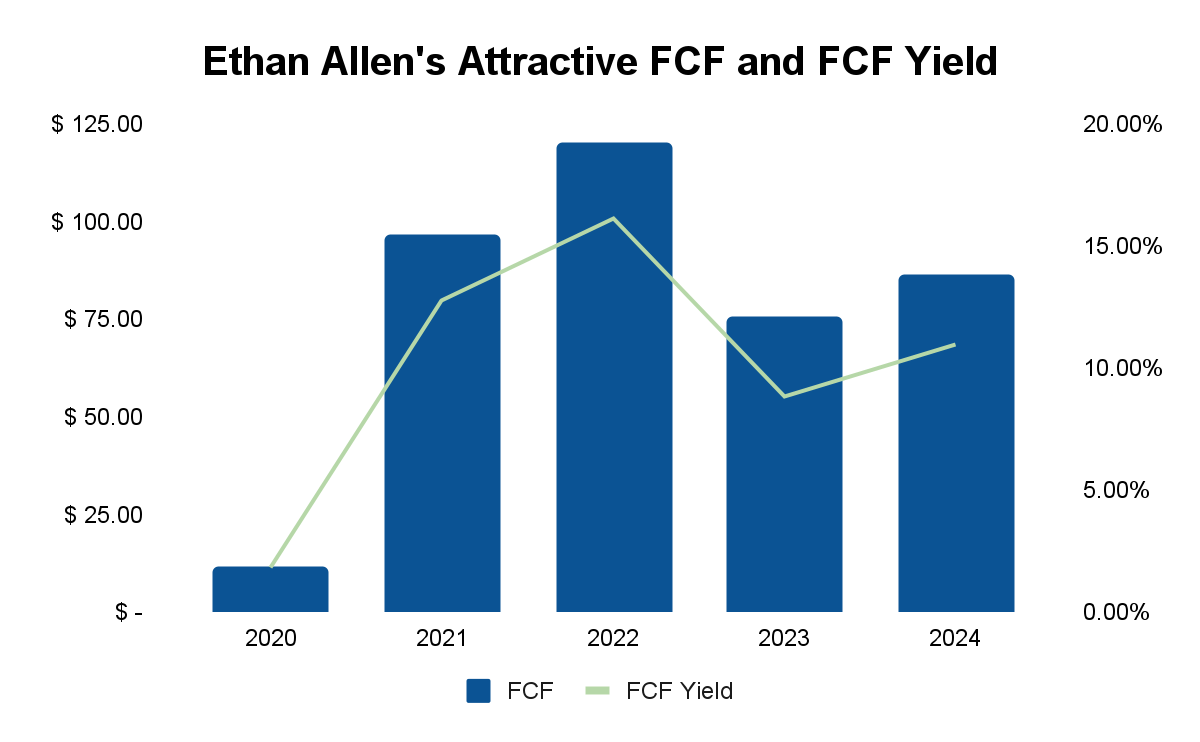
Between 2020 and 2024, the company has paid out $209.68 million in dividends. Given the scale of the company’s FCF, there is obviously ample space to increase dividends, and from a safety point of view, dividends are well-supported by the FCFs being generated by the firm.
Ethan Allen is Undervalued
The value of Ethan Allen’s current operations and cash flows is known as economic book value (EBV), and can be calculated using the formula,
Economic Book Value = (NOPAT/WACC) – Adjusted total debt (including off-balance sheet debt) + Excess cash + Unconsolidated Subsidiary Assets + Net Assets from Discontinued operations – Value of Outstanding Employee stock option liabilities – Under (Over) funded Pensions – Preferred stock – Minority interests + Net deferred compensation assets + Net deferred tax assets
My calculation of Ethan Allen’s EBV, which represents pre-strategy intrinsic value of the firm, can be seen in the table below:
|
(Values in millions) |
2020 |
2021 |
2022 |
2023 |
2024 |
|
NOPAT |
$ 11.90 |
$ 66.52 |
$ 102.81 |
$ 105.48 |
$ 78.75 |
|
WACC |
5.28% |
5.02% |
7.87% |
7.48% |
7.64% |
|
Excess Cash |
$ 42.78 |
$ 70.34 |
$ 80.23 |
$ 133.14 |
$ 128.72 |
|
Net Assets from Discontinued Operations |
$ – |
$ – |
$ – |
$ – |
$ – |
|
Net Deferred Tax Liability |
$ (0.94) |
$ (3.95) |
$ (3.60) |
$ (2.42) |
$ (2.42) |
|
Net Deferred Compensation Assets |
$ – |
$ – |
$ – |
$ – |
$ – |
|
Fair Value of Unconsolidated Subsidiary Assets (non-op) |
$ – |
$ – |
$ – |
$ – |
$ – |
|
Fair Value of Total Debt |
$ 168.14 |
$ 161.45 |
$ 146.71 |
$ 173.42 |
$ 143.33 |
|
Fair Value of Preferred Capital |
$ – |
$ – |
$ – |
$ – |
$ – |
|
Fair Value of Minority Interests |
$ – |
$ 0.02 |
$ 0.03 |
$ 0.02 |
$ 0.06 |
|
Value of Outstanding ESO After-Tax |
$ 0.17 |
$ 1.50 |
$ 0.31 |
$ 0.77 |
$ 0.93 |
|
Pensions Net Funded Status |
$ – |
$ – |
$ – |
$ – |
$ – |
|
Economic Book Value (EBV) |
$ 98.94 |
$ 1,228.44 |
$ 1,235.88 |
$ 1,366.62 |
$ 1,012.75 |
|
Split Adjusted Shares Outstanding (thousands) |
25,053.00 |
25,237.00 |
25,323.00 |
25,356.00 |
25,679.00 |
|
EBV per Share |
$ 3.95 |
$ 48.68 |
$ 48.80 |
$ 53.90 |
$ 39.44 |
|
Stock Price (closing) |
$ 11.83 |
$ 27.60 |
$ 20.21 |
$ 28.28 |
$ 30.33 |
|
Price to Economic Book Value per Share (PEBV) |
3.00 |
0.57 |
0.41 |
0.52 |
0.77 |
Source: Company filings and author calculations
As the table shows, since 2021, Ethan Allen’s EBV has been lower than its price, indicating that the market expects a decline in the firm’s profitability, despite, as we have seen, that the firm has actually grown its profits. At an EBV of $39.44, Ethan Allen is trading at a discount to its stock market price of $30.33. There is ample margin of safety for the conservative investor. Given an EBV of $39.44, this thesis should be attractive until the stock price reaches that level.
Conclusion
Ethan Allen’ has been underestimated by both GAAP metrics and the market. In the last five years, NOPAT has compounded by nearly 46% a year. In that time, the firm has reduced the size of its invested capital, so that it is good to note that both revenues and NOPAT have grown with a declining invested capital. The firm’s invested capital turns have also improved. The combination of invested capital turns and NOPAT margin gains have caused its ROIC to rise. Management has created enormous value, with economic earnings of $163.22 million since 2020. FCF generation has also been impressive, with the company earning $389.15 million in FCF, while paying out $209.68 million in dividends. That FCF is available at a very attractive yield of 10.97%. Yet, despite these results, Ethan Allen is trading at a 23% discount to its intrinsic value.
Read the full article here