


Two months ago, I said here that WM Technology (NASDAQ:MAPS) could double soon, and it is barely higher. The company reported its Q2 earlier this month after being late on its Q4 and Q1 earlier this year. The stock is the largest in my model portfolio that I share with subscribers of 420 Investor, and I continue to expect that it could rally significantly.
WM Technology Q2 Was Solid
When I last wrote about MAPS, it was less than a month after they released their Q4 and Q1 financials, which were late. I thought those reports were excellent, and I am happy to see the company reporting now on a timely basis.
In Q1, the company reported revenue of $44.4 million, down 4% from a year earlier, with adjusted EBITDA rising 35% to $9.6 million. In Q2, revenue expanded sequentially to $45.9 million, which was 5% below the year-ago level. Adjusted EBITDA expanded sequentially to $10.1 million, which was down 1% from a year ago and well ahead of the $7 million guidance that management had provided at the end of Q1. The company reported a net profit of $0.01 per share again. Cash increased for the debt-free company to $41.3 million. In H1, cash flow from operations exceeded $20 million, substantially above the $4.1 million it generated in the first half of 2023.
The WM Technology Outlook Is Strong
The press release shared management’s expectations for Q3. Revenue is projected to be $44 million, and adjusted EBITDA is forecast at $7 million. These would be down from a year ago, when the company reported revenue of $48 million with adjusted EBITDA of $11 million.
Ahead of the Q2 report, an analyst was expecting revenue to grow 3% to $194 million, according to AlphaSense. Now, the consensus is still $194 million. Adjusted EBITDA is still expected to be $12 million, according to this source. As I argued last time, this makes little sense! The year-to-date adjusted EBITDA has been $19.7 million already, and the company is guiding to $7 million in Q3.
I use 2025 estimates for forecasting year-end 2024 prices, and AlphaSense has no estimate currently. I discussed in the last article how I am expecting 2025 adjusted EBITDA to be about $39 million. I cited Pablo Zuanic, an analyst, who was looking for 2025 revenue to be $216.2 million with adjusted EBITDA of $38.9 million. I don’t believe that he has updated his forecasts yet from July, which was before the Q2 report. He had lowered his 2025 projected revenue to $199.6 million with adjusted EBITDA of $37.2 million, a margin of 18.6%. The Q2 report showed lower revenue than he was projecting them, but adjusted EBITDA was substantially higher. His Q3 forecast is in line with what management has guided.
Clearly, MAPS is not widely followed by the analyst community. I believe that it has been paring its customer base to get paid by its customers, and this is reflected in the lower customer count, but higher average collected per customer. The company hosted a call with no questions asked by investors or analysts. If 280E gets wiped out, as the rescheduling recommended by the DEA would do, I expect growth could be even stronger than investors are expecting.
The MAPS Chart Is Good
MAPS is up 48.5% year-to-date, and this strong performance may scare some potential investors away for now. I recognize that the stock was really hammered in late 2023, though, and this gain isn’t so real. The stock is way down from where it was in late 2021. Here is the last year:
thinkorswim at Schwab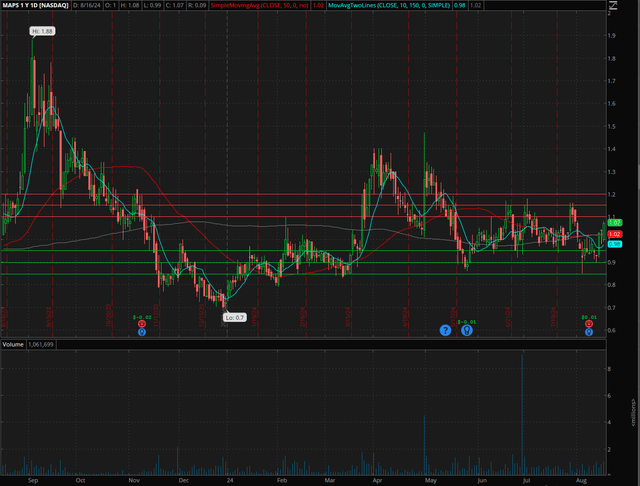
I like this chart! That low that was set in late 2023 was above the all-time low set earlier that year and looks very solid. I see support at $0.95, perhaps a bit higher too. I currently see resistance in the $1.10-1.20 area, but this is way below the recent peak and the earlier peak almost a year ago.
While the stock is up a lot more in 2024 than the Global Cannabis Stock Index that New Cannabis Ventures maintains, since the big news of potential rescheduling hit in late August a year ago, MAPS, down 16.4%, has lagged the market, which is up 22.1% since then. MAPS is in that index again (since 6/30).
WM Technology Is a Cheap Cannabis Stock
When I wrote about MAPS in June, I shared a target of $2.02 for year-end, which was based upon an enterprise value to projected adjusted EBITDA in 2025 of 8X, a pretty low multiple. I suggested that a multiple of 10X made more sense, and it could be a lot higher.
Updating for the share-count and cash level, I get $2.06, which is 92% higher in just 4 1/2 months. Again, I think that 10X makes more sense, and this would be $2.51.
While I like the valuation, there are risks. First, the stock will likely decline if 280E remains in place. The DEA is very likely to reschedule cannabis from Schedule 1 to Schedule 3, but it is not yet a done deal. If 280E remains in place, cannabis stocks are likely to be pressured, and Weedmaps customers will continue to struggle.
Another potential risk is delisting. It’s not just MAPS, but all NASDAQ stocks have a $1 minimum. It’s possible that the company could reverse-split its stock to adhere to this rule, if necessary, but it’s not certain that it will do so. There have been companies in the cannabis sector that have gone from NASDAQ to the OTC, and, while this seems unlikely to happen with MAPS, it would be a big problem.
Finally, the company is heavily exposed to California. It is working on broadening its exposure in other markets, and I think that new cannabis markets with lots of stores can be a good thing. Ohio just went legal for adult-use, and perhaps Florida will be going legal for adult-use next year if voters approve a ballot initiative this November. Perhaps California’s market improves too.
Conclusion
My position size in my Beat the Global Cannabis Stock Index model portfolio is 20%, my largest holding currently. That model portfolio is up 38.4% year-to-date now thanks to a very strong week last week. While MAPS is up a bit more, I think it is the best stock for cannabis investors.
The stock is up, and the fundamentals are improving. The stock is way down too, and it is very cheap. I continue to think that there is substantial upside here.
Read the full article here