


This article series aims at evaluating ETFs (exchange-traded funds) regarding the relative past performance of their strategies and metrics of their current portfolios. Reviews with updated data are posted when necessary.
REGL strategy
ProShares S&P MidCap 400 Dividend Aristocrats ETF (BATS:REGL) started investing operations on 2/03/2015 and tracks the S&P MidCap 400 Dividend Aristocrats Index. REGL has a portfolio of 49 stocks, a dividend yield of 2.34% and a total expense ratio of 0.40%. Distributions are paid quarterly.
As described by Proshares in the prospectus, eligible companies must be in the S&P Midcap 400 index and have increased dividend payments every year for at least 15 years. The index contains a minimum of 40 stocks, equally weighted with a limit of 30% for any sector. If fewer than 40 stocks pass the rules, companies with shorter dividend growth histories may be included. The index is reconstituted once a year and rebalanced quarterly. The portfolio turnover rate in the most recent fiscal year was 29%. This article will use as a benchmark the parent index S&P 400, represented by SPDR S&P Midcap 400 ETF (MDY)
REGL portfolio
REGL invests exclusively in U.S. companies, with about 29% of asset value in mid-caps and 71% in small caps, based on Fidelity classification. The heaviest sector is financials (30.5% of asset value), followed by utilities (22.8%), industrials (16%) and materials (12.2%). Other sectors are below 7% individually and 19% in aggregate. Compared to the parent index, REGL massively overweights utilities, and to a lesser extent financials, materials and consumer staples. It ignores energy, communication and technology.
Sector breakdown (chart: author; data: ProShares, SSGA)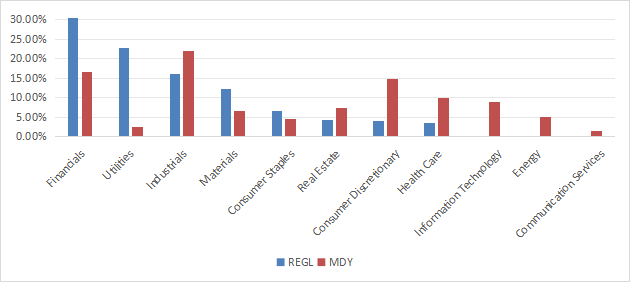
Positions are equal-weighted at every rebalancing, but they may drift with price action. The current top 10 holdings, listed in the next table, represent 22.2% of assets. These are the constituents with the highest momentum since the last rebalancing. The largest position weighs 2.5%, so risks related to individual companies are low.
|
Ticker |
Name |
Weight |
EPS growth %TTM |
P/E TTM |
P/E fwd |
Yield% |
|
ERIE |
Erie Indemnity Co. |
2.51% |
49.87 |
48.59 |
42.88 |
1.04 |
|
PII |
Polaris Inc. |
2.34% |
-46.82 |
15.16 |
23.02 |
3.05 |
|
RRX |
Regal Rexnord Corp. |
2.27% |
-100.00 |
N/A |
17.66 |
0.83 |
|
RNR |
RenaissanceRe Holdings Ltd. |
2.21% |
519.07 |
4.98 |
6.49 |
0.62 |
|
SLGN |
Silgan Holdings, Inc. |
2.18% |
0.26 |
18.01 |
14.01 |
1.48 |
|
ORI |
Old Republic International Corp. |
2.17% |
-9.17 |
14.86 |
12.21 |
3.01 |
|
R |
Ryder System, Inc. |
2.16% |
-4.61 |
13.00 |
11.75 |
2.28 |
|
UMBF |
UMB Financial Corp. |
2.14% |
1.88 |
13.42 |
11.83 |
1.50 |
|
ELS |
Equity LifeStyle Properties, Inc. |
2.11% |
23.30 |
38.11 |
38.33 |
2.71 |
|
WLK |
Westlake Corp. |
2.11% |
-79.66 |
72.45 |
20.09 |
1.39 |
Fundamentals
REGL is cheaper than MDY regarding valuation ratios (except price-to-sales), as reported in the next table. These numbers must be considered with caution due to the heavy weight of financials, whose ratios are on average lower and less reliable than in other sectors. Aggregate growth rates are mixed: earnings growth is inferior to the benchmark, while cash flow growth is superior.
|
REGL |
MDY |
|
|
Price/Earnings |
17.95 |
19.57 |
|
Price/Book |
2.11 |
2.54 |
|
Price/Sales |
1.77 |
1.5 |
|
Price/Cash Flow |
8.87 |
11.81 |
|
Earnings Growth |
11.29% |
18.97% |
|
Cash Flow Growth |
15.35% |
9.68% |
Source: Fidelity website
In my ETF reviews, risky stocks are companies with at least 2 red flags among: bad Piotroski score, negative ROA, unsustainable payout ratio, bad or dubious Altman Z-score, excluding financials and real estate where these metrics are unreliable. Here, risky stocks weigh 6.4% of asset value, which is good point. However, keep in mind that 30% of the portfolio (financials) is not taken into account by this ratio.
According to my calculation of aggregate metrics reported in the next table, quality is close to the benchmark.
|
REGL |
MDY |
|
|
Altman Z-score |
3.33 |
3.44 |
|
Piotroski F-score |
5.67 |
5.74 |
|
ROA % TTM |
6.39 |
5.32 |
Performance
Since 3/1/2015, REGL has lagged the mid-cap benchmark by 76 bps in annualized return, but it shows a slightly higher risk-adjusted performance (Sharpe ratio in the next table) thanks to a lower volatility. The drawdown risk also looks lower based on historical data.
|
Tot.Return |
Annual.Return |
Drawdown |
Sharpe ratio |
Volatility |
|
|
REGL |
140.07% |
10.87% |
-36.37% |
0.58 |
15.37% |
|
MDY |
154.34% |
11.63% |
-42.22% |
0.54 |
19.20% |
The sum of annual distributions has increased from $0.60 to $1.76 per share between 2016 and 2023. This 7-year dividend growth of 193% has greatly outpaced the cumulative inflation (about 27% in the same time, based on CPI).
REGL distribution history (Seeking Alpha)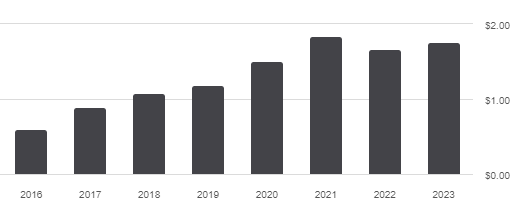
REGL vs. competitors
The next table compares characteristics of REGL and five dividend-growth ETFs in US equities:
- Vanguard Dividend Appreciation Index Fund (VIG)
- ProShares S&P 500 Dividend Aristocrats ETF (NOBL)
- iShares Core Dividend Growth ETF (DGRO)
- VictoryShares Dividend Accelerator ETF (VSDA)
- ProShares Russell 2000 Dividend Growers ETF (SMDV)
|
REGL |
VIG |
NOBL |
DGRO |
VSDA |
SMDV |
|
|
Inception |
2/3/2015 |
4/21/2006 |
10/9/2013 |
6/10/2014 |
4/18/2017 |
2/3/2015 |
|
Expense Ratio |
0.40% |
0.06% |
0.35% |
0.08% |
0.35% |
0.40% |
|
AUM |
$1.58B |
$97.35B |
$12.30B |
$29.60B |
$258.87M |
$726.76M |
|
Avg Daily Volume |
$3.73M |
$143.63M |
$48.65M |
$75.58M |
$460.18K |
$6.86M |
|
Dividend Yield, TTM |
2.34% |
1.73% |
2.04% |
2.22% |
2.02% |
2.74% |
|
5-year Dividend Growth (annualized) |
11.74% |
10.26% |
8.68% |
9.30% |
17.67% |
10.58% |
|
Dividend Frequency |
Quarterly |
Quarterly |
Quarterly |
Quarterly |
Monthly |
Quarterly |
REGL has the highest expense ratio, tie with the small-cap fund SMDV. It is ranked 4th in size (assets under management) and 5th in liquidity (average daily dollar volume). It comes in second position for the current yield and 5-year dividend growth rate.
The next chart plots total returns, starting on 4/19/2017 to match all inception dates. REGL is second to last, behind the funds including large companies.
REGL vs competitors since 4/19/2017 (Seeking Alpha)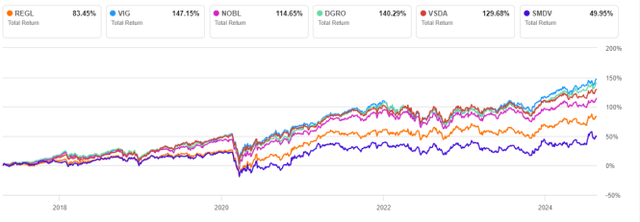
It is in the middle of the pack over the last 3 years:
REGL vs competitors, year-to-date (Seeking Alpha)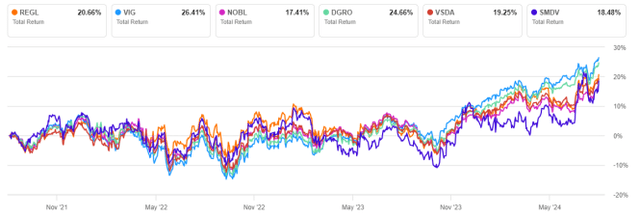
Takeaway
ProShares S&P MidCap 400 Dividend Aristocrats ETF holds stocks of the S&P Midcap 400 index with a 15-year track record of dividend growth. REGL is overweight in financials, but its equal-weight methodology guarantees diversification across holdings. It is slightly better than its parent index S&P Midcap 400 regarding valuation. REGL has lagged the mid-cap benchmark since its inception, but shows a lower volatility and a better risk-adjusted performance. Moreover, its dividend growth rate is excellent. Nonetheless, REGL has lagged dividend growth ETFs including large companies due to outperformance of this size segment in the last few years. In conclusion, REGL is a reasonable choice for investors seeking a dividend-growth fund outside the large cap universe.
Read the full article here