


The July Retail Sales report put out by the Census Bureau was much stronger than expected. So far in August, weekly Johnson Redbook retail sales figures are likewise encouraging. These trends bode well for consumer companies big and small, particularly as the back-to-school shopping season starts to wrap up.
While we won’t know the full results for the August through October period, sales and profit tallies for domestic retailers until November, but so far, so good. And from a macro level, solid consumer spending is key to a soft landing, something the FOMC is hopeful for as it begins its rate-cutting campaign, likely on September 18.
I reiterate a buy rating on the SPDR S&P Retail ETF (NYSEARCA:XRT). I see the small Consumer Discretionary and Consumer Staples ETF, focused on the brick-and-mortar and e-commerce niche, as inexpensive on valuation with decent technicals, though the next six weeks on the calendar have historically featured downside price action over the past 10 years.
Shares are up about 20% since my previous analysis, buoyed by strength in the consumer and a broader market uptrend, though it has underperformed the tech-heavy S&P 500 since February 2023.
Johnson Redbook Sales Rebound to 5% YoY
Trading Economics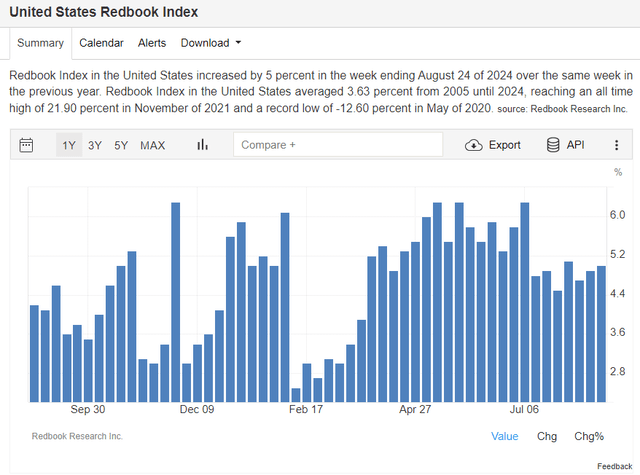
July Retail Sales Soar Past Expectations
Daily Shot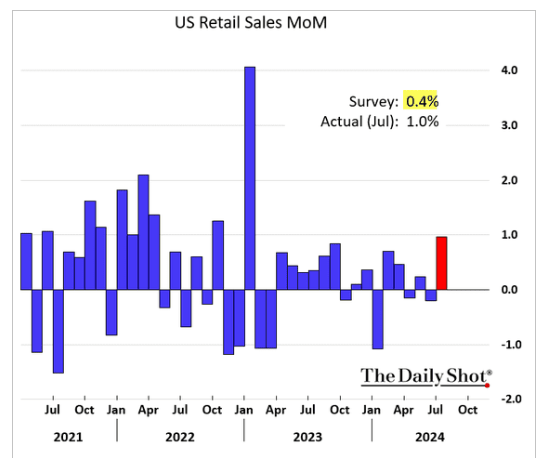
According to the issuer, XRT seeks to provide exposure to the retail segment of the S&P Total Market Index, which comprises the following sub-industries: Apparel Retail, Automotive Retail, Computer & Electronic Retail, Department Stores, Drug Retail, Food Retailers, Broadline Retail, Consumer Staples Merchandise Retail, and Specialty Stores. The ETF features a modified equal-weighted approach which provides the potential for unconcentrated industry exposure across large, mid, and small-cap stocks.
While XRT gets a lot of press during the retail earnings season, it remains a small ETF with just $425 million in assets under management as of August 26, 2024. The fund features a low to moderate 0.35% annual expense ratio and pays a low dividend yield of 1.3%, about on par with that of the SPX.
Share-price momentum has been tepid in recent months despite a resilient consumer, though the broader trend is higher, and I will detail key price levels on the chart to monitor at the end of the article. XRT is also considered a risky ETF due to its sometimes volatile price action, but there’s little in the way of single-stock risk since the fund employs a modified equal-weight construction and management method. Liquidity, meanwhile, is solid with almost five million shares traded daily and considering its 30-day median bid/ask spread of just a single basis point, per SSGA Funds.
There have been many changes in retail and the investment world in the past 18 months. Looking closer at the allocation, the two-star, Gold-rated ETF by Morningstar remains a small-cap value fund, but its price-to-earnings ratio has increased by about three figures since my Q1 2023 analysis.
Still, relative to the earnings multiple of the S&P 500, its valuation discount remains significant at almost seven points. Key risks include a downturn in consumer spending if we see weaker US real GDP growth or if input costs such as labor expenses or more expensive raw materials come about in 2025.
XRT: Portfolio & Factor Profiles
Morningstar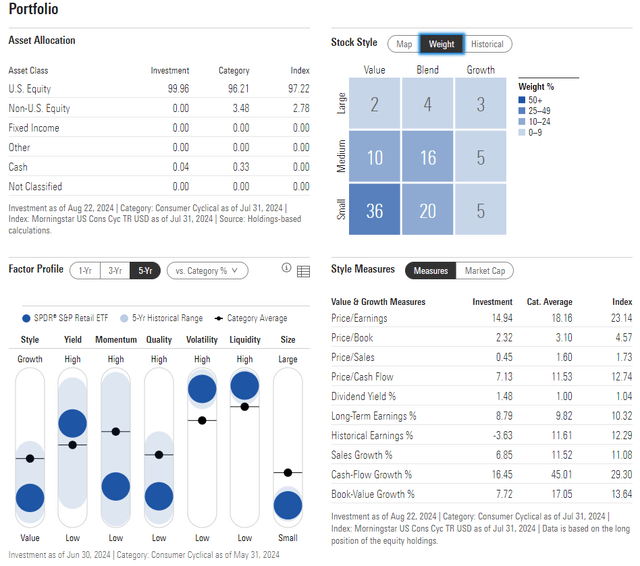
XRT is primarily exposed to the Consumer Discretionary and Consumer Staples sectors. Both areas of the market are up on the year, but the former is the worst-performing S&P 500 sector in 2024 while the latter is making fresh all-time highs this week.
What’s ideal for diversification is that the management and rebalancing processes ensure that no single stock strays far from a weight of about 1.2%. The best-performing stocks rise to the top before a rebalance, such as Carvana (CVNA) today.
XRT: Holdings & Dividend Information
Seeking Alpha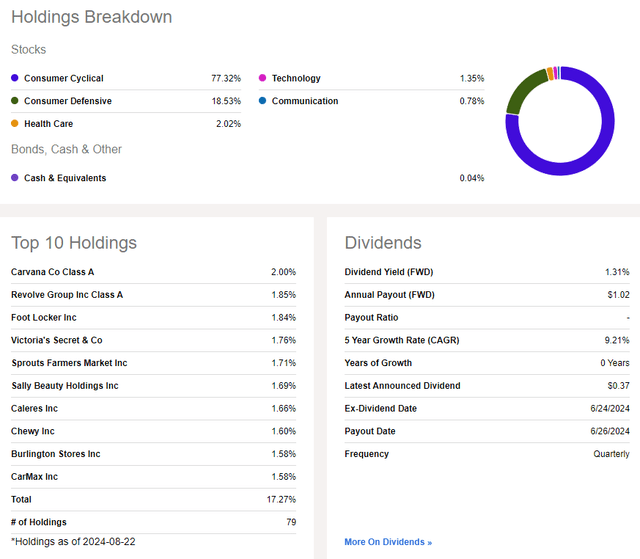
Seasonally, September is the weakest month of the year. Since 2014, there have been just two positive finishes to the third quarter, but gains have generally been had in October and November. So, we could see some volatility and weakness in the ETF’s share price in the weeks ahead.
XRT: September Weakness Is Common
Seeking Alpha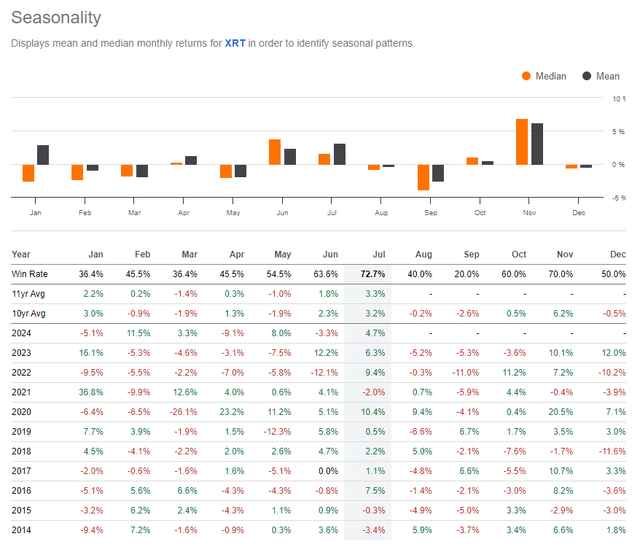
The Technical Take
With a low valuation and weak near-term seasonal trends, XRT’s technical situation is encouraging for the most part, Notice in the chart below that shares currently range between $70 and $80, but with a rising long-term 200-day moving average, I assert that the bulls control the primary trend. Also take a look at the $68 mark – that’s where XRT met selling pressure about a year ago before a new uptrend began. As long as XRT is above $67 to $70, a long position makes sense.
The RSI momentum gauge at the top of the graph is important too, but it’s merely neutral. I make that call because the oscillator hasn’t reached either technical overbought or oversold conditions. I’d like to see a bullish range ensue, between $40 and $85. Finally, if XRT manages to break above resistance at $80, then a measured move upside price target to $90 would be in play.
Overall, XRT’s technical setup is favorable despite the fund’s underperformance to the broader market since my February 2023 analysis.
XRT: Rising 200dma, $80 Resistance
Stockcharts.com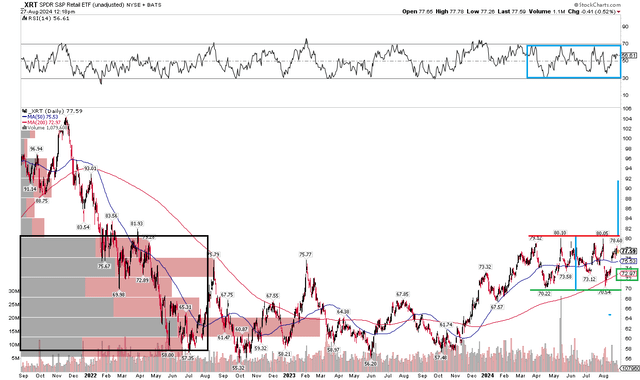
The Bottom Line
I have a buy rating on XRT. The retail ETF sports a compelling valuation, while its technical chart suggests upside ahead once we get through this often tough time on the calendar.
Read the full article here