


JMOM strategy
JPMorgan U.S. Momentum Factor ETF (NYSEARCA:JMOM) started investing operations on 11/08/2017 and tracks the JPMorgan US Momentum Factor Index. It has 283 holdings, a 30-day SEC yield of 0.82% and an expense ratio of 0.12%. As described in the prospectus by JPMorgan Asset Management, constituents are selected in the Russell 1000 index based on a momentum factor. More specifically, the underlying index…
…targets equity securities which have higher risk-adjusted returns relative to those of their sector peers over a twelve month period. The twelve month returns are divided by the twelve month volatility of the returns to get the risk-adjusted returns.
The portfolio turnover rate in the most recent fiscal year was 43%. This article will use as a benchmark the parent index Russell 1000, represented by iShares Russell 1000 ETF (IWB).
JMOM portfolio
The portfolio is almost exclusively invested in U.S. companies (about 99% of asset value), with a focus on large and mega caps (61%). JMOM is overweight in technology and communication. Its sector breakdown is quite close to the parent index. Compared to the Russell 1000, JMOM is moderately overweight consumer discretionary, industrials, and underweight financials and consumer staples. Selecting stocks relative to their sector peers makes the sector composition less dependent on sector rotations and market cycles, but on the downside it limits the concentration in trending industries.
Sector breakdown (chart: author; data: JP Morgan, iShares)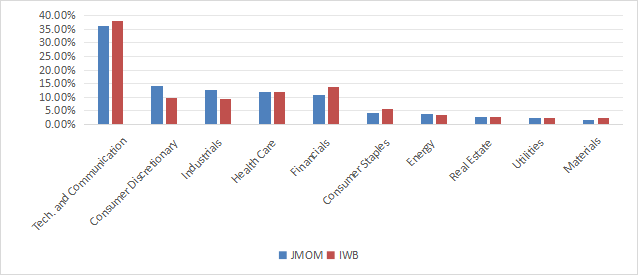
The current top 10 holdings, listed in the next table, represent 18.2% of asset value. The heaviest position weighs 2.2%, so risks related to individual companies are low. JMOM is less concentrated than IWB, where the top 3 names weigh between 5% and 7%.
|
Ticker |
Name |
Weight% |
EPS growth %TTM |
P/E TTM |
P/E fwd |
Yield% |
|
BRK.B |
Berkshire Hathaway, Inc. |
2.22% |
-21.04 |
14.90 |
23.24 |
0 |
|
LLY |
Eli Lilly & Co. |
2.06% |
12.95 |
117.44 |
57.82 |
0.55 |
|
META |
Meta Platforms, Inc. |
1.98% |
128.32 |
26.46 |
24.38 |
0.39 |
|
AAPL |
Apple, Inc. |
1.83% |
10.38 |
34.99 |
34.28 |
0.44 |
|
MSFT |
Microsoft Corp. |
1.80% |
21.86 |
35.01 |
31.25 |
0.73 |
|
GOOGL |
Alphabet, Inc. |
1.76% |
47.48 |
23.21 |
21.18 |
0.49 |
|
AVGO |
Broadcom Inc. |
1.74% |
-26.54 |
67.51 |
32.69 |
1.34 |
|
NVDA |
NVIDIA Corp. |
1.72% |
414.59 |
55.21 |
41.96 |
0.03 |
|
COST |
Costco Wholesale Corp. |
1.58% |
19.53 |
54.96 |
54.70 |
0.52 |
|
UNH |
UnitedHealth Group, Inc. |
1.53% |
-32.34 |
39.11 |
21.36 |
1.42 |
Data: Portfolio123.
Fundamentals
Usually, momentum funds have pricey valuation ratios. Unexpectedly, JMOM is on par with the Russell 1000 based on price/earnings and cheaper in price/sales, as reported in the next table. Price/cash flow and price/book ratios are a bit higher, though. Growth rates are superior to the benchmark. The cash flow growth looks especially good.
|
JMOM |
IWB |
|
|
Price/Earnings TTM |
25.73 |
25.97 |
|
Price/Book |
5.14 |
4.41 |
|
Price/Sales |
2.3 |
2.87 |
|
Price/Cash Flow |
18.56 |
17.72 |
|
Earnings growth |
23.29% |
22.28% |
|
Sales growth |
10.05% |
8.61% |
|
Cash flow growth |
17.41% |
8.62% |
Performance
Since its inception, JMOM has followed quite closely its parent index, as plotted on the chart below. It looks marginally more volatile, but the gap in total return is hardly significant (less than 3% in almost 7 years).
JMOM vs. IWB, since 11/09/17 (Seeking Alpha)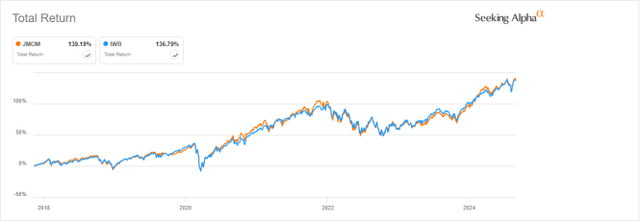
Nevertheless, JMOM is 5.1% ahead of IWB over the last 12 months:
JMOM vs. IWB, 12-month return (Seeking Alpha)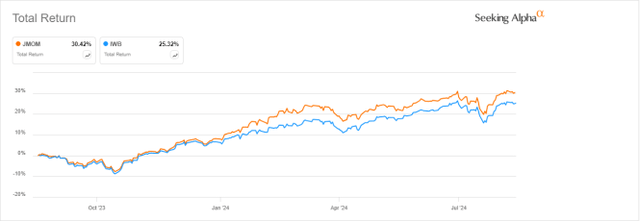
JMOM vs. competitors
The next table compares characteristics of JMOM and five momentum ETFs with a tilt to large companies:
- Invesco S&P 500 Momentum ETF (SPMO)
- iShares MSCI USA Momentum Factor ETF (MTUM)
- Invesco Dorsey Wright Momentum ETF (PDP)
- Vanguard U.S. Momentum Factor ETF (VFMO)
- Alpha Architect U.S. Quantitative Momentum ETF (QMOM).
|
JMOM |
SPMO |
MTUM |
PDP |
VFMO |
QMOM |
|
|
Inception |
11/8/2017 |
10/9/2015 |
4/16/2013 |
3/1/2007 |
2/13/2018 |
12/1/2015 |
|
Expense Ratio |
0.12% |
0.13% |
0.15% |
0.62% |
0.13% |
0.29% |
|
AUM |
$1.09B |
$2.30B |
$9.85B |
$1.25B |
$641.86M |
$246.09M |
|
Avg Daily Volume |
$3.24M |
$82.80M |
$130.13M |
$1.45M |
$4.62M |
$1.07M |
|
Holdings |
283 |
102 |
128 |
102 |
615 |
52 |
|
Top 10 |
18.20% |
65.10% |
44.22% |
25.09% |
11.90% |
21.94% |
|
Turnover |
43.00% |
81.00% |
111.00% |
97.00% |
73.00% |
193.00% |
Data: Seeking Alpha.
JMOM has the cheapest fee by a very short margin. The next chart plots total returns, starting on 2/15/2018 to match all inception dates. JMOM comes in second position, significantly behind SPMO.
JMOM vs competitors, since 2/19/2018 (Seeking Alpha)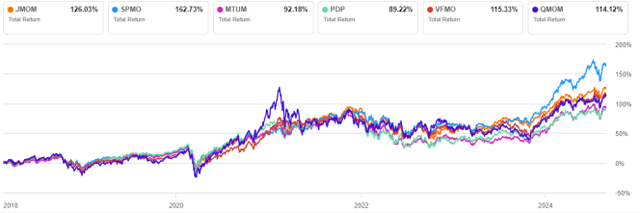
In 2024 to date, The JPMorgan fund is in the middle of the pack:
JMOM vs SPMO, year-to-date (Seeking Alpha)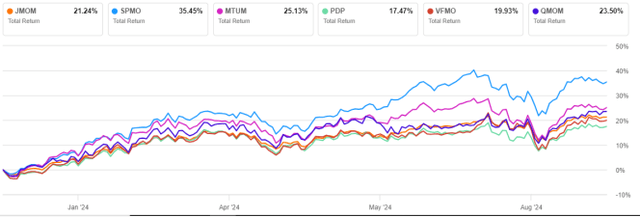
Takeaway
JPMorgan U.S. Momentum Factor ETF selects Russell 1000 stocks based on 12-month risk-adjusted return. JMOM is well-diversified across holdings, but overweight in technology, with a sector breakdown close to its parent index. JMOM is also close to the benchmark in valuation (a good point for a momentum fund) and in return since inception (which is disappointing in the context of a strong bull market). JMOM ranks well among other momentum ETFs, but it has significantly underperformed the S&P 500 Momentum Index, tracked by SPMO.
Read the full article here