


Not even Nvidia (NVDA) earnings could liven up a quiet week for the S&P 500 (SPY) which continues to trade just below the all-time high of 5669. Even so, a highest ever weekly close and monthly close were still made and it seems a break-out is setting up as September gets underway.
But what kind of break-out will we get? A textbook, clean move higher only happens some of the time and there are many ways the S&P500 could behave as it makes a new high; some bullish, some bearish and some just plain confusing.
Of course, I don’t know in advance what will happen, but there should be clues to the various outcomes as things develop. This week’s article will outline what to look for, and expectations for September. Various techniques will be applied to multiple timeframes in a top-down process which also considers the major market drivers. The aim is to provide an actionable guide with directional bias, important levels, and expectations for future price action.
S&P 500 Monthly
August closed at the highs of the large monthly range and just 21 points shy of the all-time high. A bullish bar was clearly formed, although the “hammer” pattern is usually formed near the lows of a large move rather than the highs. The last time a similar bar was formed was October 2014, which is apt given the comparison made in last week’s article.
SPX Monthly (Tradingview)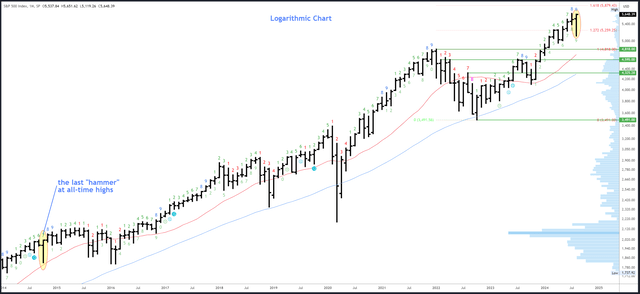
Seasonality in September remains on the weak side, and this is particularly true in election years which close higher only 50% of the time and average out at a -0.46% loss. It’s not the best environment for a sustained break-out.
The 5669 top remains the obvious resistance point. The next major target for new highs is the 6124 level. This is a measured move, where the 2022-2024 rally will be equal in size to the 2020-2022 rally. It is unlikely to be reached this side of the election, but is a possible destination at some point in this bull market. Near-term, the 5879 level is a more interesting target as it fits with the expectations for this stage of the rally as outlined out last week. It can be seen on the log chart above and is the 161.8% Fibonacci extension of the 2022 bear market.
5390 and the August low of 5119 are initial supports.
The August bar completed the upside Demark exhaustion count. It may have played out already with the correction of nearly 10%, but its effect could linger and limit rallies ahead of the election. The next exhaustion signal will take at least 9 months to form.
S&P 500 Weekly
The S&P500 took a much-needed rest this week and a higher high, higher low and higher close were all formed, making this a bullish bar. As concluded last week, “some momentum loss could be expected and a consolidation in the 5550-5669 range would be healthy.” The close near the highs suggests this phase could be over and a break-out could happen early next week.
SPX Weekly (Tradingview)
5669 is the only resistance. 6010 is the 161.8* Fibonacci extension of the July-August drop.
5550 is initial support. There’s not much compelling weekly support below that until 5324-5358. The 20-week MA will rise to around 5400 next week.
Next week will be bar 4 (of a possible 9) in a new upside Demark exhaustion count.
S&P 500 Daily
The recent rally and consolidation has formed a classic “bull flag” and Friday’s higher volume advance suggests this is about to break higher. Here are some pointers on how this might unfold:
- a clean, textbook break-out would unfold with a high volume bar that breaks above 5669 (ideally it gaps above) and then closes higher. Closing higher again in the following session should cement the break-out.
- a less emphatic break-out would unfold with a drift through 5669. There may be closes above 5669 and then a close back below, but the key is to hold higher lows with 5560 and ideally 5581. This is my expected scenario and could lead to a persistent slow move higher in the first half of September.
- a strong break above 5669 which then reverses and closes back below 5651 could be potentially bearish. However, it would need to follow through with a drop below 5550 and even 5500 to really shift the chart negative.
- there are many traders watching the 5669 level and making knee-jerk reactions to every move. The price action may therefore be messy and it’s better to react to inflection points such as 5500 rather than to jump to conclusions over minor fluctuations such as daily closes above/below 5669.
SPX Daily (Tradingview)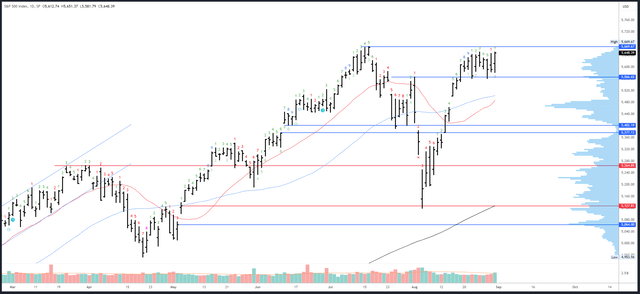
5550-5560 is initial support. The gap at 5500 is more important, with the 20dma and 50dma rising to the same area. The 5390-400 area is still relevant, but a return to this area would reflect a weak trend and delay the expected break-out, likely until after the election.
The choppy conditions mean no Demark exhaustion signal has advanced and no new signals can complete next week.
Drivers/Events
While the broader market reaction to NVDA earnings was positive, the loss of this leading stock may limit the S&P500’s gains and is another reason to believe any break-out won’t be very strong. The NVDA chart remains bullish, but the loss of momentum suggests either more consolidation is needed, or at best, a slow drift higher will unfold.
Next week’s main event will be the Jobs Report on Friday. This is a massively important release given the weakness last month and the subsequent reaction. It is also the key to whether the Fed will cut by 25bps or 50bps in the September FOMC meeting. Given its significance, large directional trades are unlikely to be made ahead of the release and this could again dampen any attempted break-out in the S&P500 early in the week.
The Jobs Report is expected to show the unemployment rate dropping back to 4.2% and +164K jobs added. This would be a sign of stabilization and a market positive. Anything significantly worse should have a negative effect, but would mean the Fed would then cut 50bps instead of 25bps and I don’t expect a similar reaction to early August. Context is key here – the last Jobs Report came several weeks into a correction with the S&P500 down nearly -4% already; sentiment / positioning were already bearish and a bottom was formed the next session. The scenario now is almost the opposite.
ISM PMIs are due for release on Tuesday and Thursday and are very likely overshadowed by the Jobs Report.
Probable Moves Next Week(s)
The bigger picture view remains bullish and a break to new all-time highs is expected. However, the context suggests this may not be a clean, strong break-out. With NVDA no longer leading the rally, and Friday’s NFP looming large, the action around 5669 could be erratic. Moreover, September is traditionally the weakest month and a strong, sustained trend ahead of the election looks unlikely.
It may well be a case of two steps forward, one step back in the coming weeks and I don’t think this is a time to read too much into the price action of individual sessions. Rather, the conclusion is there are good odds of the S&P500 continuing higher for at least the first half of September to above 5800. Only a weekly close below 5500 would shift the chart bearish for a move to 5390-400 and likely delay any break-out until after the election.
Read the full article here